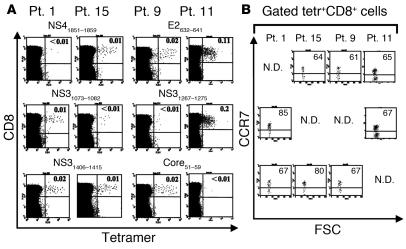
Figure 1.
Low frequencies of peripheral virus-specific CD8+ T cells expressing a dominant CM (CCR7+) phenotype. PBMCs from two representative HLA-A2+ patients (Pt. 1 and Pt. 15) and two HLA-A3+ patients (Pt. 9 and Pt. 11) were stained first with rat mAb to CCR7 and then with secondary FITC-conjugated goat anti-rat Ig, PE-Cy5–labeled anti-CD8, and the indicated PE-Cy5–labeled tetramers. (A) Dot plot analyses showing CD8+tetramer+ cell percentages. (B) Dot plots, corresponding to those reported in A, are gated on tetramer+CD8+ (Tetr+CD8+) cells, and show CCR7 staining. Results are expressed as percentage of cells, indicated in each quadrant. N.D., not determined; FSC, forward scatter.

