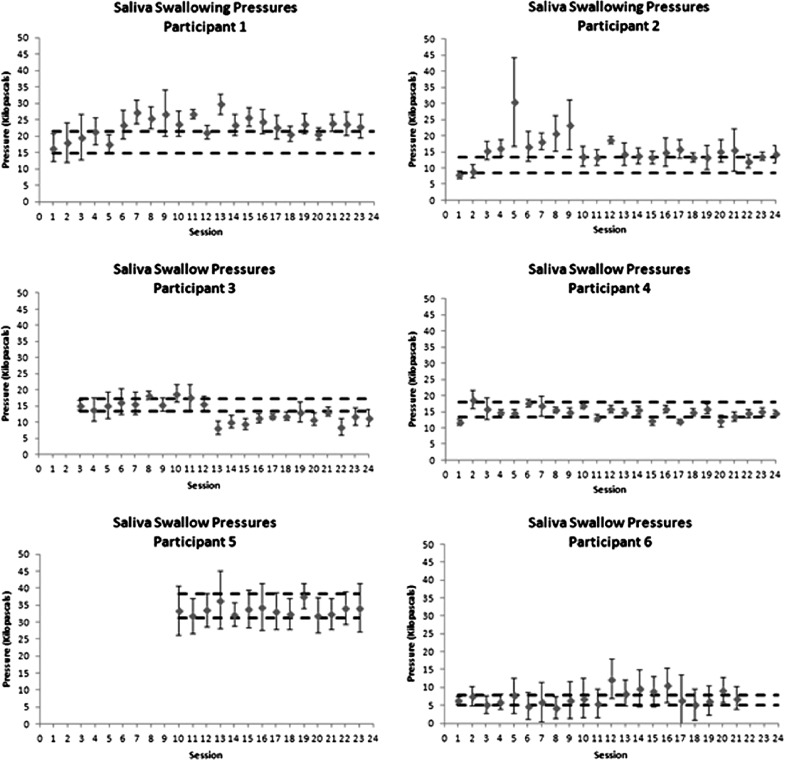
Figure 4.
Control charts showing progress in saliva swallowing pressures over the course of therapy. Dashed horizontal lines indicate a moderate effect size band around baseline performance, used as a threshold to determine whether there was evidence of change in the form of at least three consecutive data points exceeding the effect size band.

