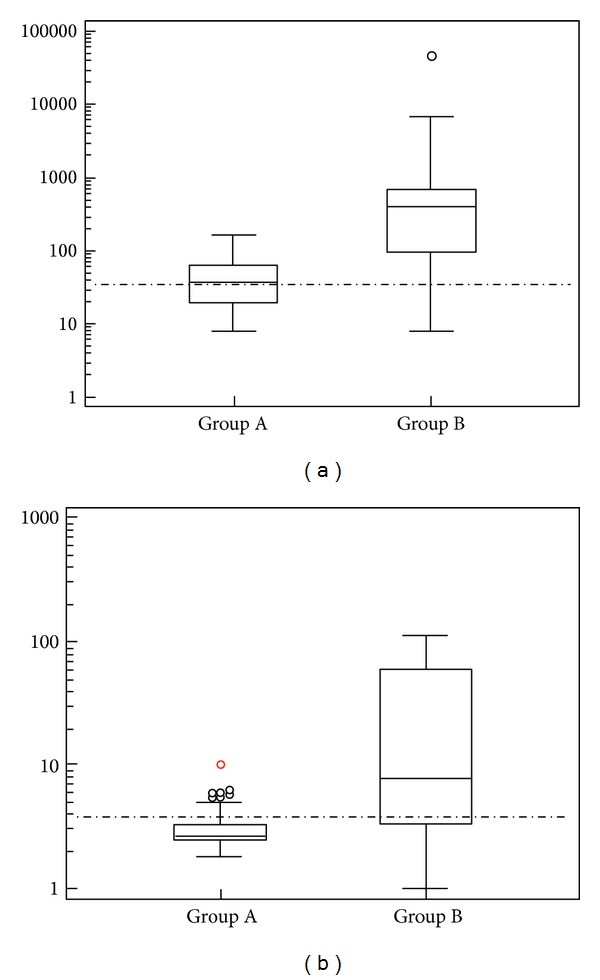
Figure 1.

(a) Box and whisker plots representing median levels and the interquartile range (box) of CA125 for each group. The dashed horizontal line represents the cut-off level for CA125 (35 U/mL). The y-axis is a logarithmic scale. Group A = endometriosis; Group B = epithelial ovarian cancer. (b) Box and whisker plots representing median levels and the interquartile range (box) of CA72-4 for each studied group. The dashed horizontal line represents the cut-off level for CA72-4 (3.8 U/mL). The y-axis is a logarithmic scale. Group A = endometriosis; Group B = epithelial ovarian cancer.
