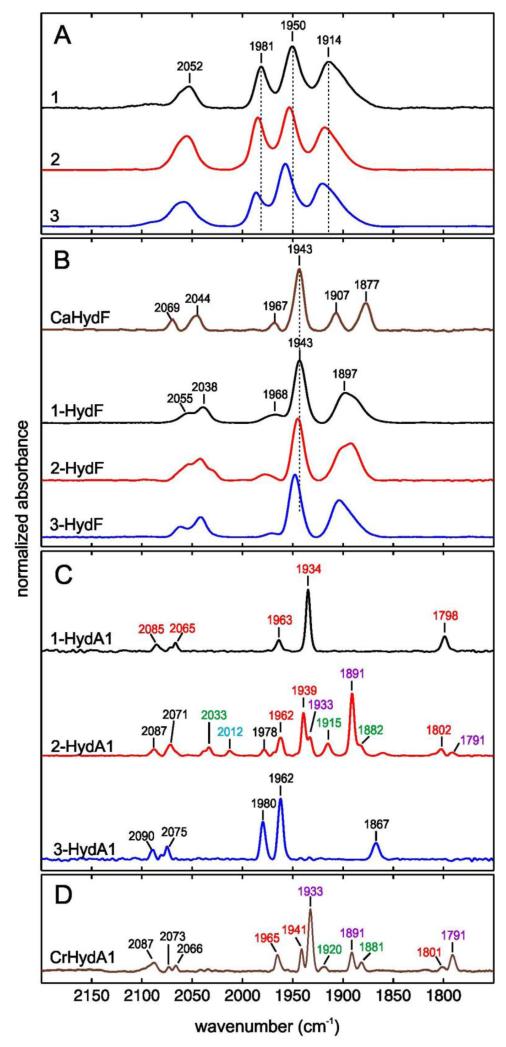
Figure 2. Normalized Fourier-transform infrared (FTIR) spectra recorded in liquid solution at 15°C.
Panel A: complexes 1-3; Panel B: CaHydF (from ref 19) and x-HydF (x = 1-3) hybrid species; Panel C: HydA1 after treatment of apo-HydA1with 1-HydF (1-HydA1), 2-HydF (2-HydA1) and 3-HydF (3-HydA1). Peak positions in the spectrum of 2-HydA1 are color coded to indicate the contributions from Hox (red), Hred (violet), Hsred (green) and Hox-CO (blue) (Figure S6 for a complete dataset). Panel D: HydA1 from C. rheinhardtii expressed in C. acetobutylicum (CrHydA1) (ref 18). Color code as in panel C. Samples of complexes 1-3 and x-HydF (x = 1-3) were prepared in HEPES buffer (20 mM, 100 mM KCl) pH 7.5. Samples of x-HydA1 have been prepared in 10 mM Tris-HCl buffer pH 8 containing sodium dithionite (2mM).

