
Figure 3.
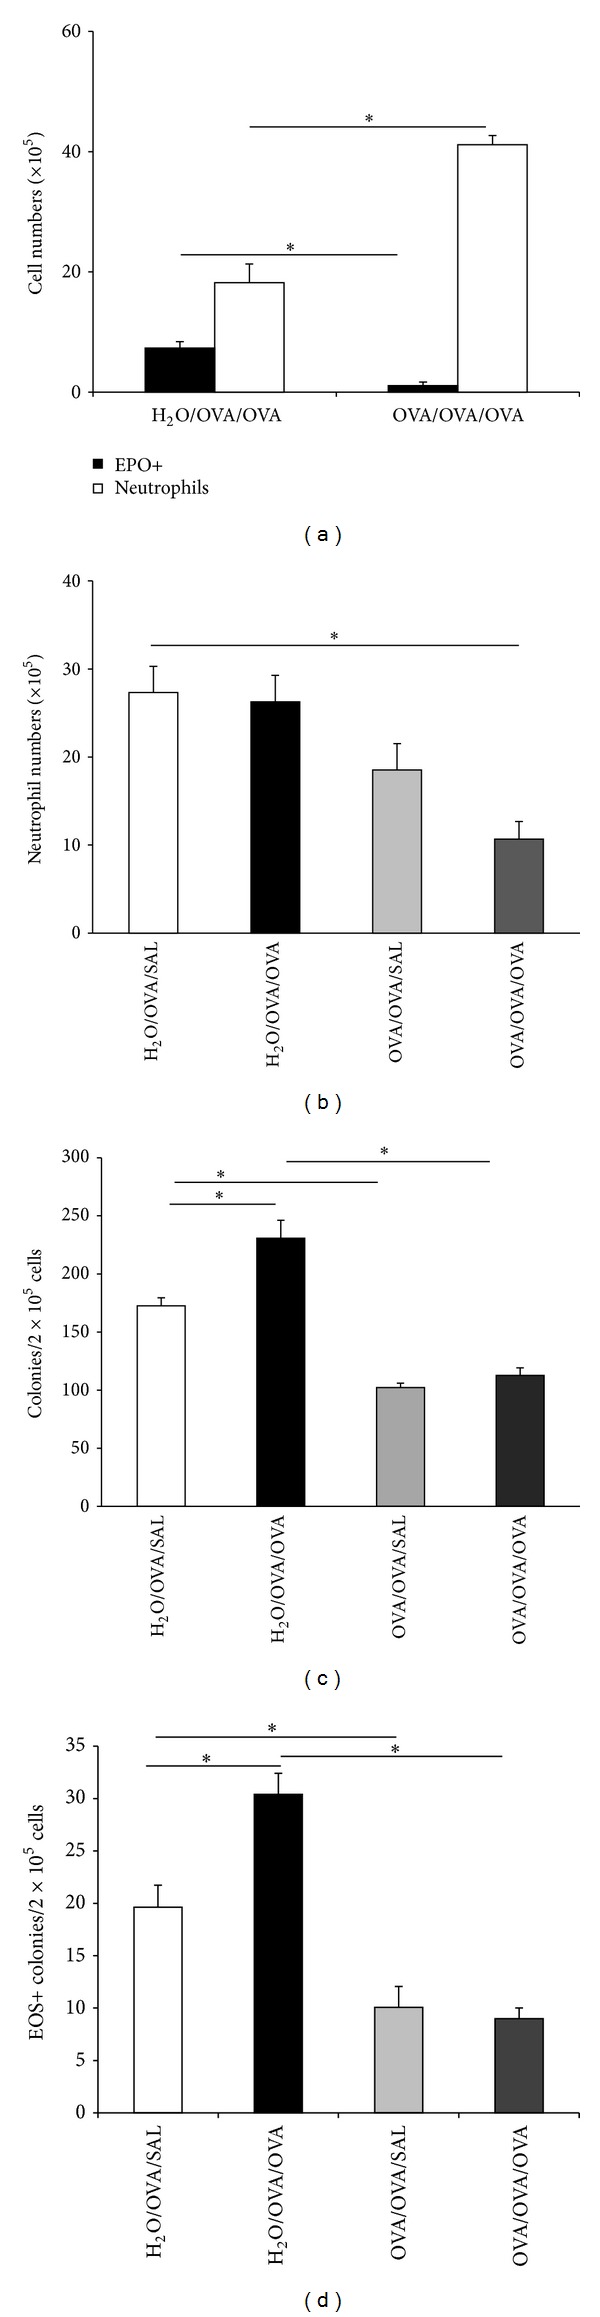
Coordinate regulation of eosinophil and neutrophil numbers by oral tolerization. Experimental groups of BP-2 mice were the same as in Figure 1. Data (Mean ± SEM) are (a) numbers of EPO+ cells (black bars) and neutrophils (white bars) in freshly harvested femoral bone marrow of OVA/OVA/OVA and H2O/OVA/OVA mice (n = 3); *P ≤ 0.003 for the indicated differences. (b) Numbers of neutrophils recovered after 6 days from liquid bone marrow cultures established with GM-CSF from the indicated groups n = 4; P = 0.005. (c) Total numbers of colonies formed by bone marrow from the indicated groups in the presence of GM-CSF (n = 6); *P ≤ 0.02 for the indicated differences. (d) Counts of colonies containing EPO+ cells from the experiment shown in (c), n = 6; P ≤ 0.009 for the indicated differences.