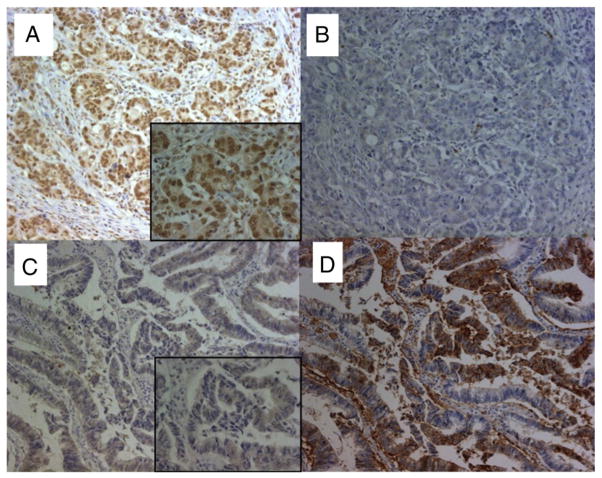
Fig. 1.
The expression of GLUT1 and hMSH3 in CRC tissues. A: Microsatellite stable CRC tissue positive for nuclear hMSH3 expression. B: Microsatellite stable CRC tissue negative for cytoplasmic GLUT1 expression. C: An EMAST-positive CRC tissue negative for nuclear hMSH3 expression. D: An EMAST-positive CRC tissue over expressing cytoplasmic GLUT1. Despite the presence of non-specific MSH3 signals in the cytoplasm of CRC cells, there was a clear difference between the stained and unstained nucleus by MSH3 IHC (×200, x 630 (insets)).

