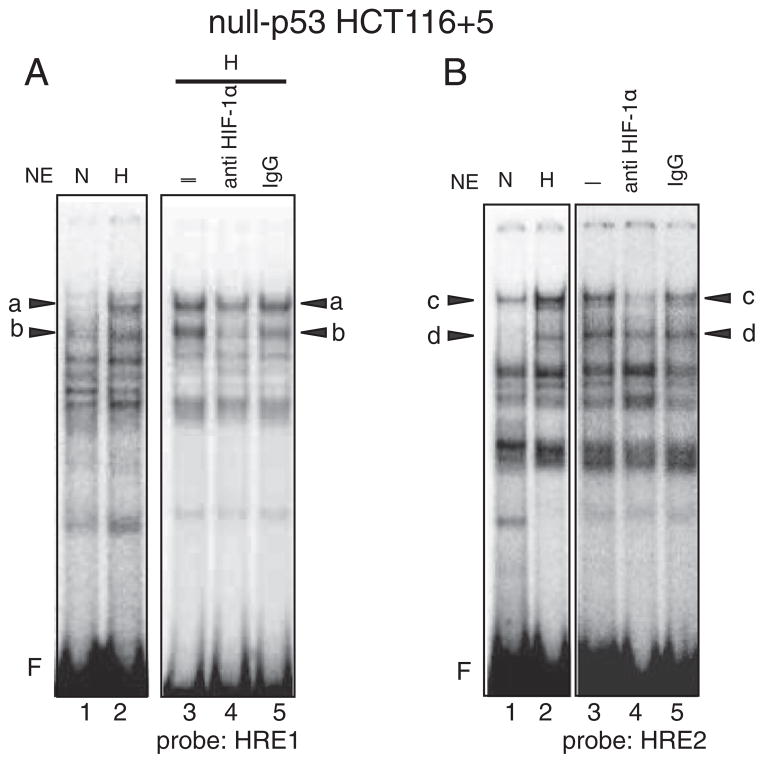
Fig. 8.
Bindings of protein complexes containing HIF-1α to the HRE1 and HRE2 sites in hypoxic null-p53 HCT116 +5. A: A hot-WT-HRE1 probe was mixed with nuclear extracts (NE) from normoxic cells (N) or hypoxic cells (H) and subjected to electrophoresis. Five species of protein complexes were induced by hypoxia (lane 2) compared to normoxic cell (lane 1). Among them bands “a” and “b” were diminished by anti HIF-1α antibody (lane 4) compared to control, nothing added (–) (lane 3) or mouse IgG added (lane 5). F: free probe. Compared to wt-p53 HCT116+5, the intensity of band “a” becomes stronger, indicating that the binding of protein complex A to the HRE1 site becomes dominant over complex B where the case is the same in hypoxic mut-p53 SW620. B: A hot-WT-HRE2 probe was mixed with nuclear extracts (NE) from normoxic cells (N) or hypoxic cells (H) and subjected to electrophoresis. Five species of protein complexes were induced by hypoxia (lane 2) compared to normoxic cell (lane 1). Among them bands “c” and “d” were diminished by anti HIF-1α antibody (lane 4) compared to control, nothing added (–) (lane 3) or mouse IgG added (lane 5). F: free probe. Compared to wt-p53 HCT116+5 (Supplementary Figs. 4A and 4B), the intensity of band “c” becomes stronger, indicating that the binding of protein complex A to the HRE2 site becomes dominant over complex B where the case is the same hypoxic mut-p53 SW620 (Supplementary Figs. 4C and 4D).

