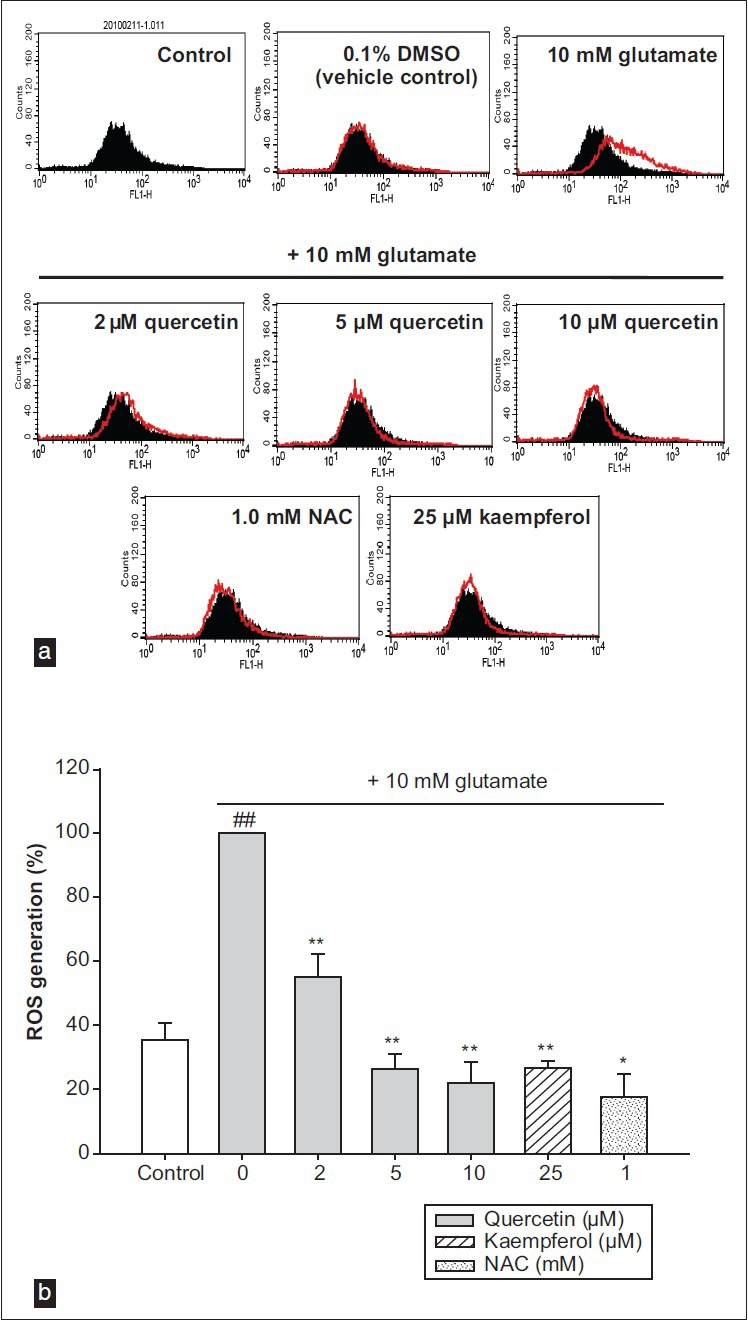
Figure 3.

(a) The histograms of flow cytometry analysis. (b) The results of flow cytometry analysis. Values represents the mean ± SD of the three independent experiments, ##P<0.01 compared to control, *P<0.05 and **P<0.01 compared to 10 mM glutamate-treated group
