
Figure 5.
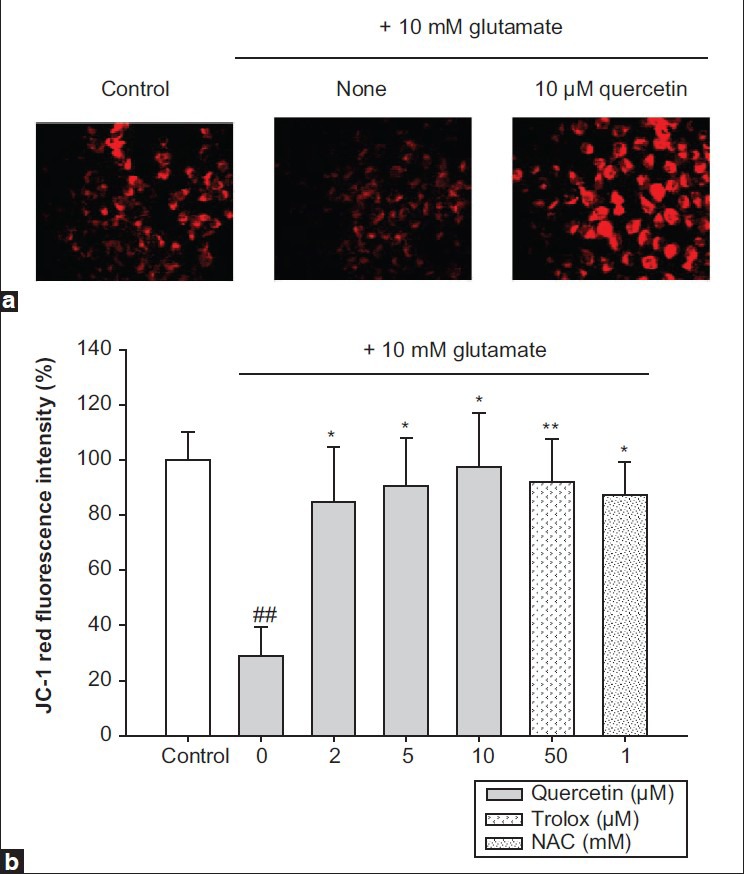
Protection of mitochondria membrane potential (ăÉm) by quercetin against glutamate stress. (a) Microscope images, (b) flow cytometric analysis. Values represents the mean±SD of the three independent experiments, ##P<0.01 compared to control, *P<0.05 and **P<0.01 compared to 10 mM glutamate-treated group