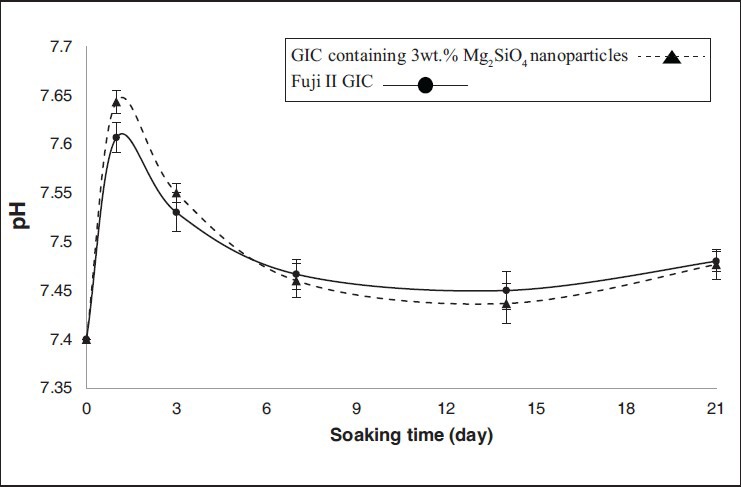
Figure 4.

Changes of the pH of the simulated body fluid solutions after soaking for various periods of time (error bars indicate standard deviation)

Changes of the pH of the simulated body fluid solutions after soaking for various periods of time (error bars indicate standard deviation)