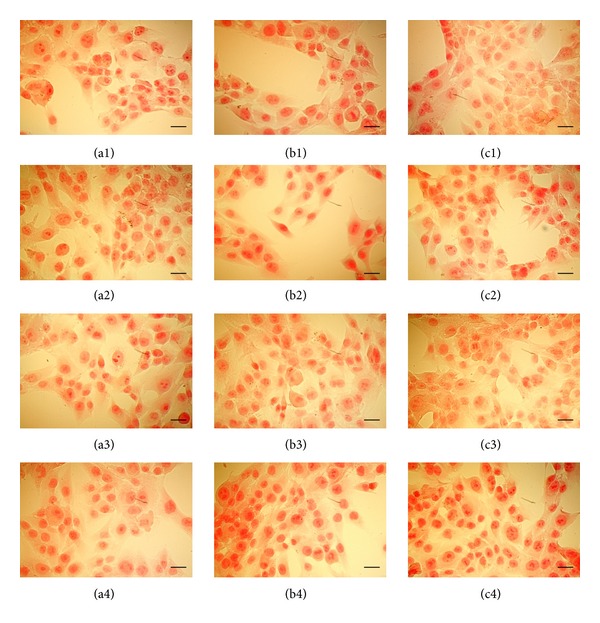
Figure 4.

Pictures were taken under optical microscopy of the cells treated for 24 h with different NSAIDs ((1) dexketoprofen; (2) ketorolac; (3) metamizole; (4) acetylsalicylic acid) at different doses ((a) control; (b) 1 μM; (c) 10 μM) in osteogenic medium and dyed with Sirius red for to see the synthesis of collagen fibrins. Bars = 50 μm.
