Fig. 7.
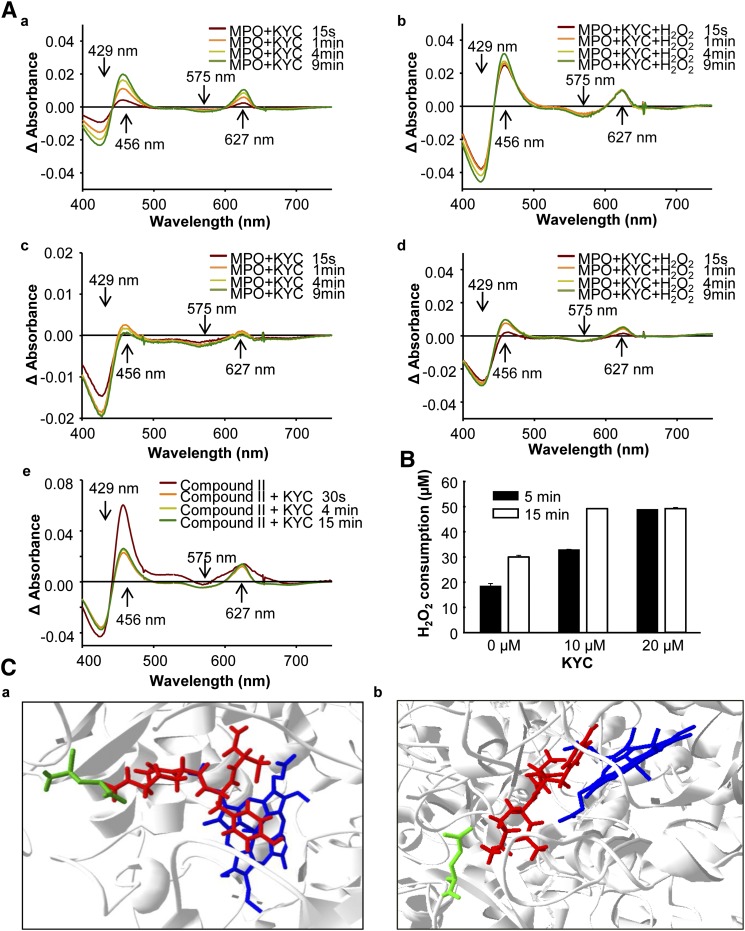
The mechanism of KYC inhibition of MPO. A: Effects of KYC on MPO UV-Vis spectra. a: MPO (1.4 μM) was incubated with KYC (50 μM) at room temperature. The changes in UV-Vis spectra were recorded at different times as indicated. b: The same reaction as in (a), except H2O2 (40 μM) was added. c: The same reaction as in (a), except 150 mM NaCl was added. d: The same reaction as in (b), except 150 mM NaCl was added. e: MPO (1.4 μM) was mixed with H2O2 (300 μM) for 20 sec. The reaction was stopped by addition of catalase. Immediately after recording the compound II spectrum, the reaction was mixed with KYC (50 μM) and the changes of heme spectra were recorded. B: H2O2 consumption of MPO. MPO (2 nM) was incubated with H2O2 (50 μM) and NaCl (100 mM) with different amounts of KYC in phosphate buffer (100 mM, pH 7.4) containing DTPA (100 μM) at room temperature. H2O2 consumption rates were determined using the Fox assay in triplicate. C: Docking of KYC in the active site of MPO (eHit v9.1, SimBioSysTM Inc., Toronto, Canada). a: shown KYC on the top of heme of MPO active center and b: shown Tyr of KYC is almost parallel to heme of MPO active center. The blue molecule is the heme of MPO, the red molecule is KYC, and the green line is the side chain of Glu116.

