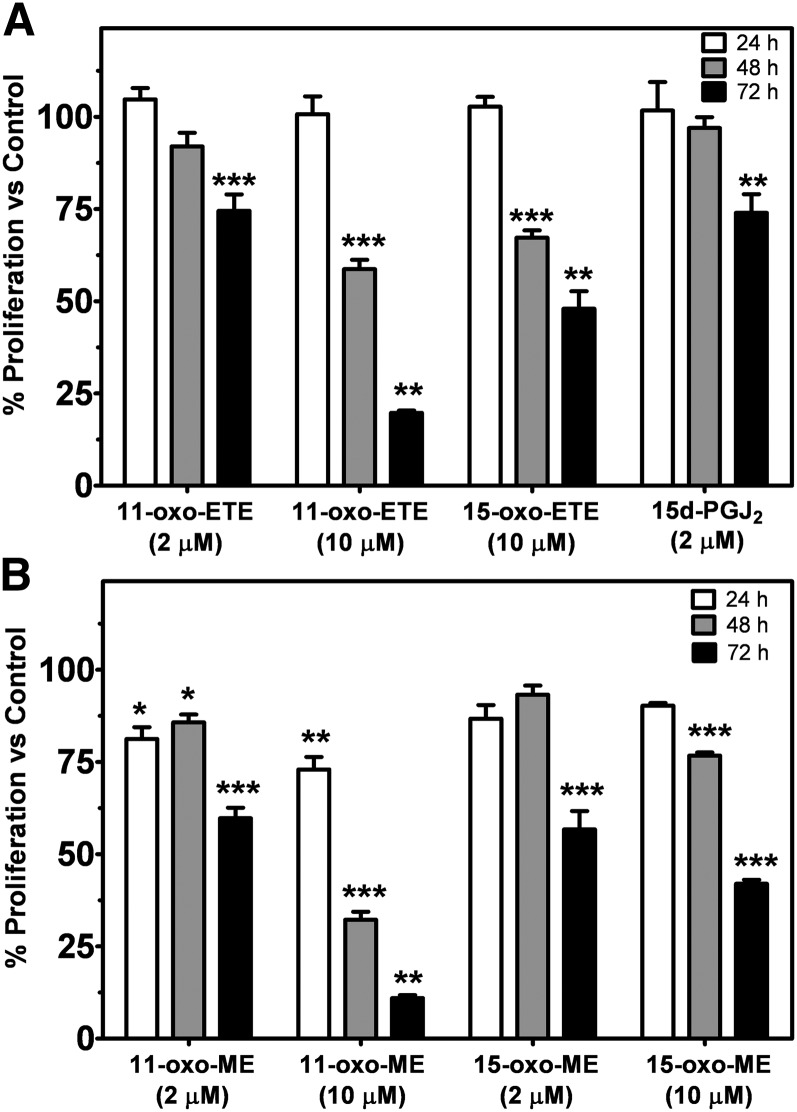
Fig. 5.
Cell proliferation measured by MTT assay with LoVo cells over multiple days with the indicated compounds in 0.25% DMSO compared with vehicle control. Treatments with the free acids are shown in (A), the methyl esters are shown in (B). Data are plotted as the means (n = 4) with SEM, representative of at least two independent experiments. Statistical significance was assessed by one-way ANOVA with post-hoc Bonferroni multiple comparison test against the respective vehicle control (*P < 0.05, **P < 0.01, ***P < 0.001).

