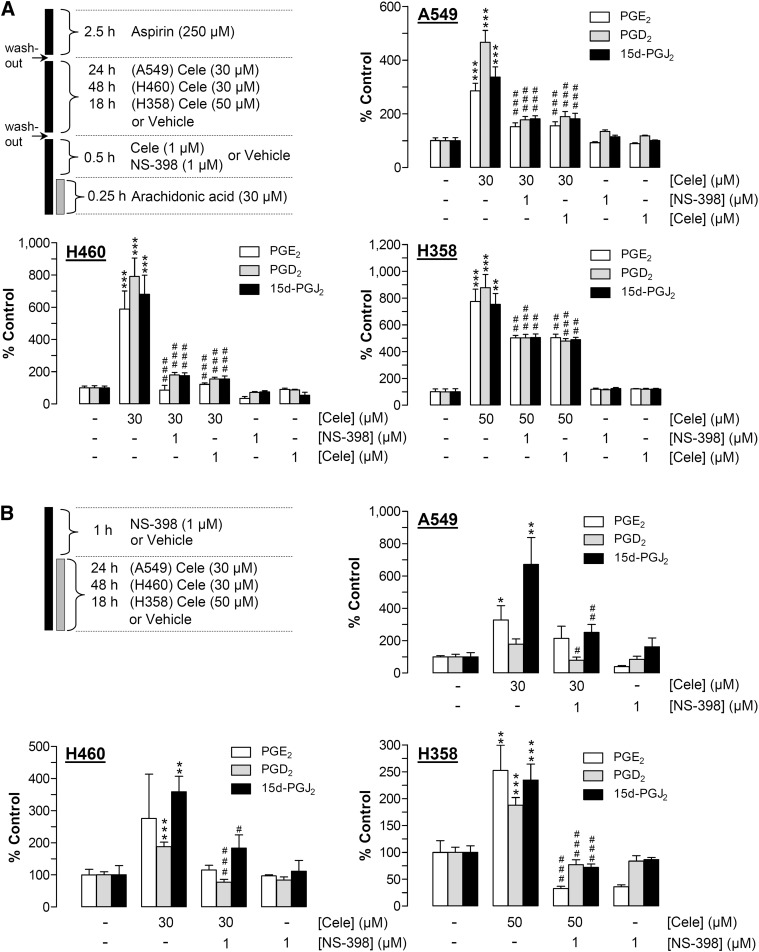
Fig. 4.
Effect of celecoxib on PG synthesis by A549, H460, and H358 cells. A: Scheme at the upper left indicates the workflow of the COX-2 activity assay: all cell lines were pretreated with 250 µM aspirin for 2.5 h prior to extensive washout and subsequent stimulation with vehicle or celecoxib at 30 µM (A549, H460) or 50 µM (H358) for 24 h (A549), 48 h (H460), or 18 h (H358). Following incubation with celecoxib, cells were washed and incubated with vehicle, NS-398 (1 µM), or celecoxib (1 µM) for 30 min. Thereafter, arachidonic acid (30 µM) was added to each well for 15 min before cell culture media were removed and analyzed for PGE2, PGD2, or 15d-PGJ2. Values are means ± SEM of n = 4 experiments. (B) According to the scheme at the upper left, cell lines were treated with vehicle or celecoxib at 30 µM (A549, H460) or 50 µM (H358) for 24 h (A549), 48 h (H460), or 18 h (H358) in the presence or absence of NS-398 (1 µM) that was added to the cells 1 h prior to the stimulation with celecoxib. PG levels (A, B) were determined in cell culture media and were normalized to cellular protein. Percent control represents comparison with vehicle-treated cells (100%) in the absence of test substances. Values are means ± SEM of n = 3–4 experiments, except A549 cells evaluated for PGE2 (n = 7–8 experiments). Basal unnormalized PG levels (B) were 299.10 ± 66.51 pM (PGE2), 9.89 ± 1.99 pM (PGD2), and 28.87 ± 5.35 pM (15d-PGJ2) in A549 cells; 358.14 ± 137.41 pM (PGE2), 8.16 ± 0.56 pM (PGD2), and 130.20 ± 36.00 pM (15d-PGJ2) in H460 cells; and 190.27 ± 31.16 pM (PGE2), 12.13 ± 1.07 pM (PGD2), and 8.11 ± 0.75 pM (15d-PGJ2) in H358 cells. *P < 0.05, **P < 0.01, ***P < 0.001 versus corresponding vehicle control; #P < 0.05, ##P < 0.01, ###P < 0.001 versus long-term incubated celecoxib; one-way ANOVA plus Bonferroni test.

