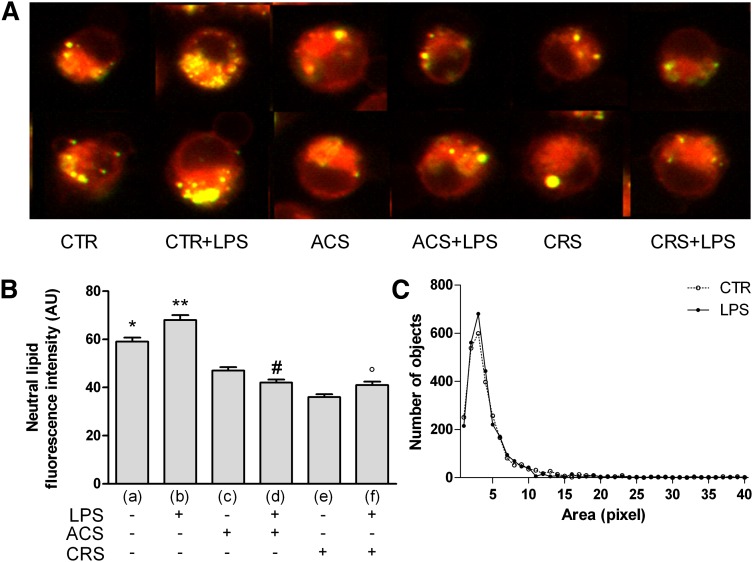
Fig. 1.
Neutral lipids in LPS-activated cells and effect of ACAT inhibition. P388D1 (CTR), and chronically inhibited cells (CRS) were activated for 72 h with LPS; simultaneously, one group of LPS-stimulated cells was treated with 4 μM Sz-58035 (ACS). At the end of incubation cells were washed, fixed in 4% PFA, resuspended in 300 nM Nile red and observed using an Olympus IX 71 inverted microscope fitted with a 20×/0.7 plan apochromatic objective. Twelve-bit images were captured using a cooled CCD camera (for details see Methods). Polar lipids display a red emission, while neutral lipids a green emission. Quantitative analysis of images was performed using the ImagePro Plus package. At least 400 cells were individually measured for each experimental group. A: Neutral lipids, stained with Nile red in the different experimental groups, are identified as yellow spots as result of the merger of the red and green channels in the imaging process. B: Quantitative analysis of Nile red green emission. C: Lipid droplet distribution profiled by number and size. Data were reported as mean ± SE. *P < 0.05; **P < 0.05 versus all; #P < 0.05 versus (c); and °P < 0.05 versus (e) (Fisher's LSD as post hoc test).

