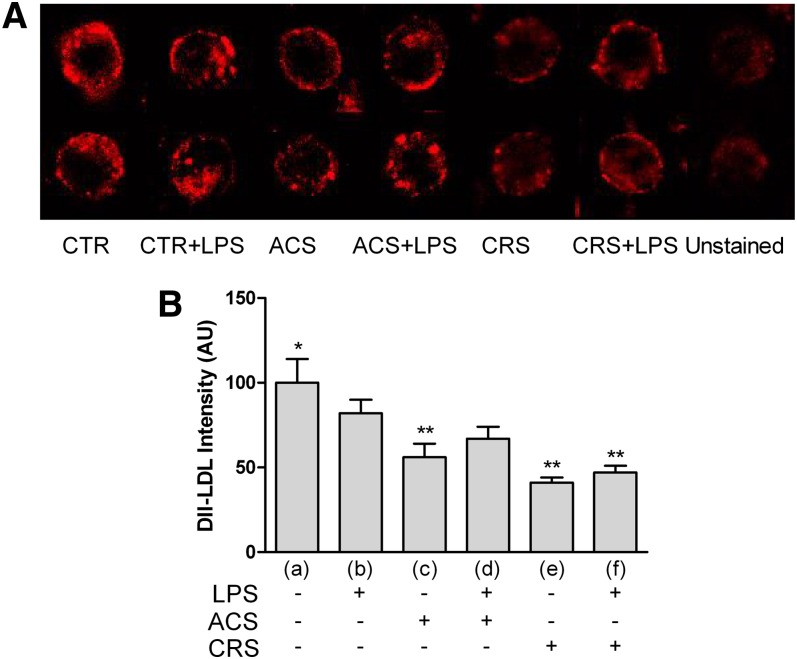
Fig. 3.
LDL binding in activated P388D1 cells and during acute or chronic ACAT inhibition. Experimental conditions were as described in Fig. 1. To evaluate binding of LDLs, the fluorescent dye Dil (Bioquote Ltd.) was used. Cells were seeded at a concentration of 2.0 × 10⁵ cells/ml and incubated at 4°C for 2 h with 10 μg/ml of Dil-LDLs (for details see Methods). At least 400 cells were measured individually for each experimental group. A: LDL binding visualized as Dil fluorescence in the different experimental groups. B: Quantitative analysis of fluorescence emission. Data were reported as mean ± SE. *P < 0.05 versus all; **P < 0.05 versus (b) (Newman-Keuls as post hoc test).

