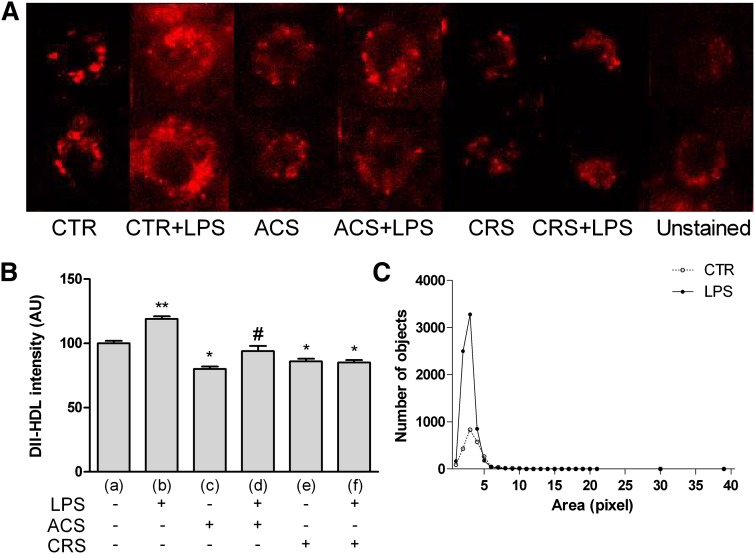
Fig. 5.
CE-HDLs in activated P388D1 cells and during acute or chronic ACAT inhibition. Experimental conditions were as described in Fig. 1. To evaluate binding of Dil-HDLs, cells were seeded at a concentration of 2.0 × 10⁵ cells/ml and incubated at 4°C for 1 h with 10 μg/ml of Dil-HDLs (for details see Methods). At least 400 cells were measured individually for each experimental group. A: Dil-HDL uptake visualized as Dil fluorescence in the different experimental groups. B: Quantitative analysis of fluorescence emission. C: Lipid droplet distribution profiled by number and size. Data were reported as mean ± SE. *P < 0.05 versus (a); **P < 0.05 versus all; and #P < 0.05 versus (c) (Newman-Keuls as post hoc test).

