Fig. 9.
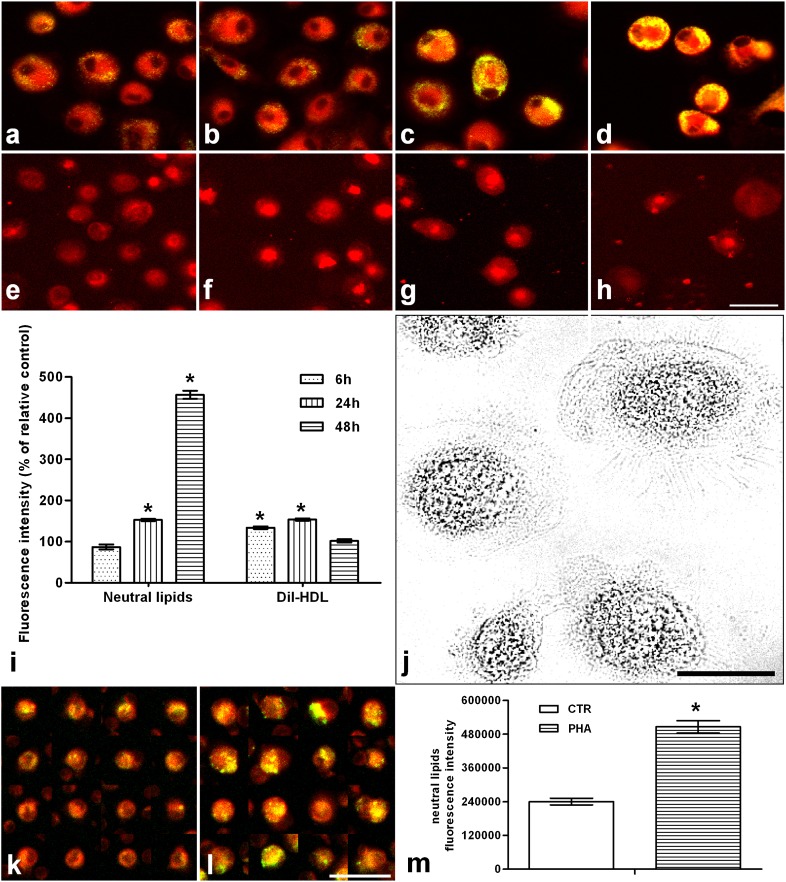
Neutral lipids and HDL uptake in 48 h LPS-activated human monocyte-derived macrophages and in monocytes cocultured with PHA-stimulated lymphocytes. a–d: Show neutral lipids stained with 300 nM Nile red (yellow/green emission) in situ, in unstimulated cells and LPS-stimulated cells for 6, 24, and 48 h, respectively. e–h: Show C-HDL uptake, visualized as Dil fluorescence, in unstimulated cells and LPS-stimulated cells for 6, 24, and 48 h, respectively (for details see Methods). Images were obtained using an Olympus IX 71 inverted microscope fitted with a 20×/0.7 plan apochromatic objective. Twelve-bit images were captured using a cooled CCD camera (for details see Methods). Quantitative analysis of images was performed using the ImagePro Plus package. At least 400 cells were individually measured for each experimental group. i: Nile red and Dil-HDL fluorescence quantitative analysis by imaging of human macrophages. j: Representative optical microscopic field of human monocyte-derived macrophages. The bottom of the figure shows Nile red fluorescence in monocytes cocultured without (k) and with (l) 48 h PHA-stimulated lymphocytes and the relative quantitative analysis (m). Bars within the images represent 30 μm. Data were reported as mean ± SD. *P < 0.001 versus relative controls (Fisher's LSD as post hoc test).

