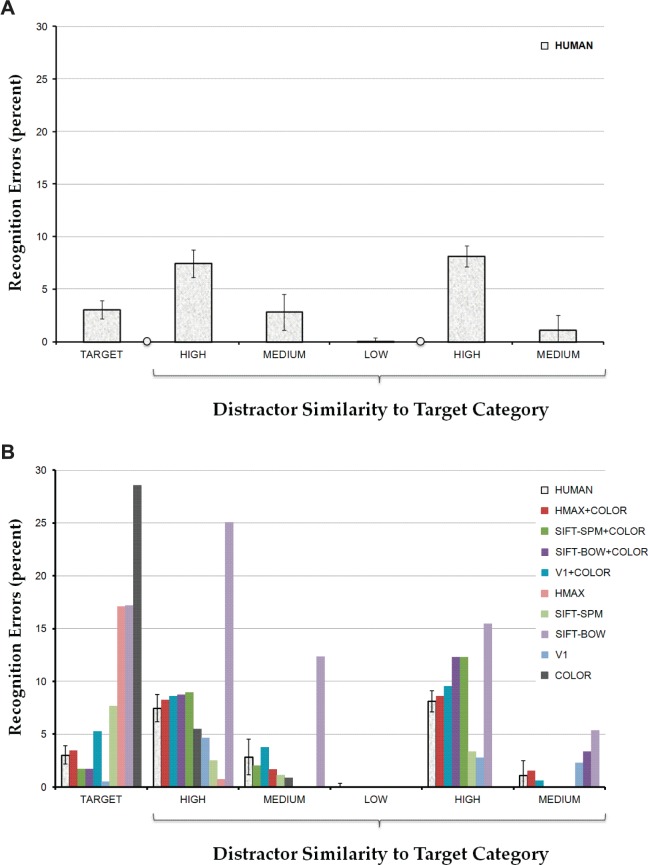
Figure 4.
Percentages of recognition errors made to the first-fixated objects, grouped by target present (leftmost bar), TA-HML (next three bars), and TA-HM (rightmost two bars) display conditions and object type (TARGET, HIGH-similarity, MEDIUM-similarity, and LOW-similarity). (A) Behavioral data. (B) Behavioral data and data from the nine models tested, with model performance plotted in order of decreasing match to the behavioral data. The error bars attached to the behavioral means show 95% confidence intervals. See text for additional details.

