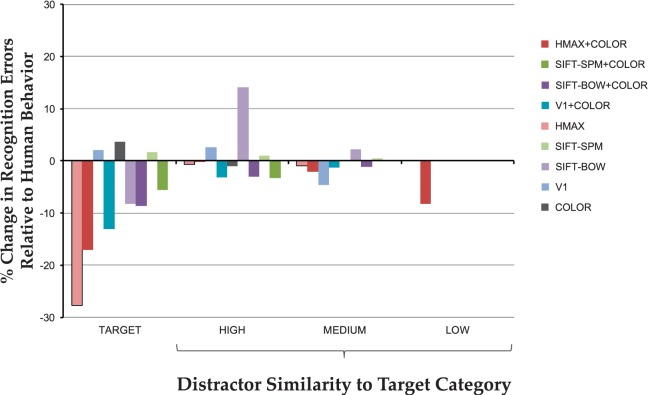
Figure 6.
Percent change in fit to the behavioral recognition error rates as a result of adding blur to the sets of training and testing images for each of the nine models tested. Positive values indicate better fits to behavioral recognition following the addition of blur, negative values indicate worse fits. Data are grouped by TARGET, HIGH-similarity, MEDIUM-similarity, and LOW-similarity object types.

