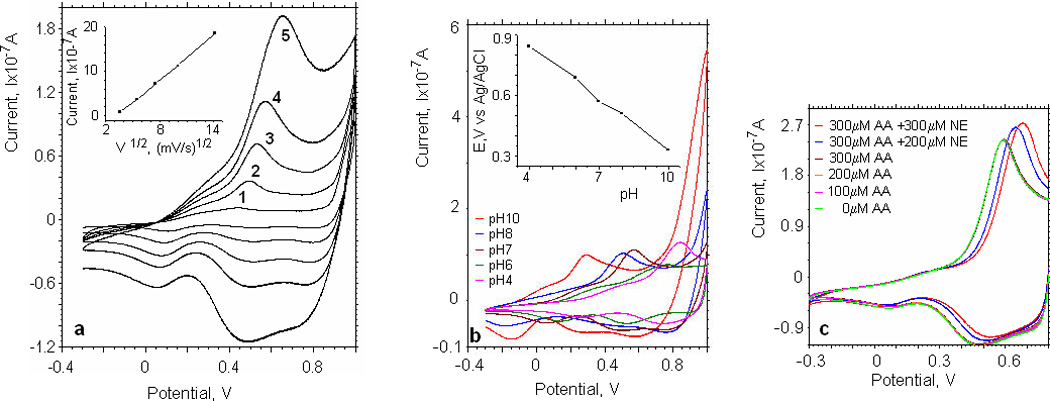
Fig.3.

Electrochemical characterization of IrOx films: (a) Cyclic voltammograms of the iridium oxide electrode in PBS solution (pH 7) at various scan rates: (1) 10; (2) 30; (3) 60; (4) 100; (5) 200 mV/s. Inset: plot of anodic peak current vs (scan rate)1/2. (b) Cyclic voltammograms of the iridium oxide electrode at different pH values (the range of pH is 4–10). Scan rate 100mV/s; norepinephrine concentration 100µM. Inset: plot of anodic peak potential vs pH. (c) Cyclic voltammograms of the iridium oxide electrode in PBS solution (pH 7) at various concentration of ascorbic acid (the range 0–300µM) and norepinephrine (the range of 200–300µM). Scan rate 100mV/s.
