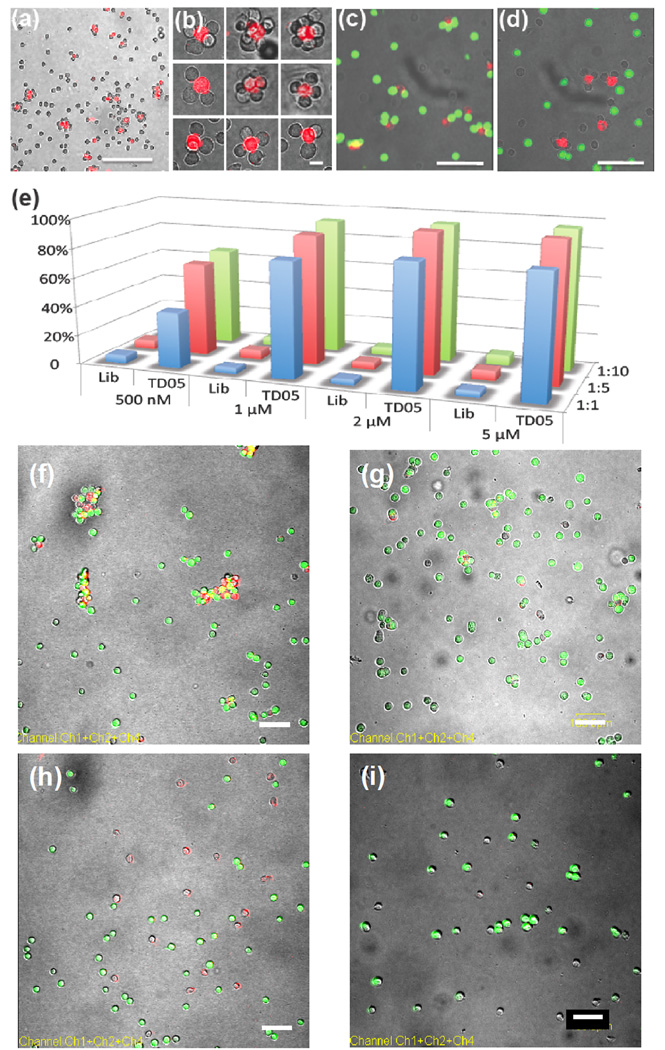
Figure 2.
Aptamer-directed assembly and disassembly of cell aggregates and quantitative analysis of aggregation. (a) 1:10 mixture of lipo-sgc8-TMR-modified Ramos and CEM cells. Scale bar: 100 µm. (b) Discrete cell clusters at higher magnification. Scale bar: 20 µm. (c) Confocal micrograph of selective cell assembly. Lipo-TD05-TMR-modified K562 cells (red fluorescence) were incubated with CellTracker Green-labeled Ramos cells (green fluorescence) and unlabeled CEM cells. No mismatched cell assembly (K562 and CEM cells or Ramos and CEM cells) was observed. Scale bar: 50 µm. (d) Confocal micrograph of selective cell assembly of lipo-Sgc8-TMR-modified K562 cells (red fluorescence) and unlabeled CEM cells. (e) Aggregation percentage of CEM cells in different sample sets. CEM-to-Ramos cell ratios are represented by blue (1:1), red (1:5) and green (1:10) bars. (f) 1:5 mixture of lipo-TD05-TMR-modified CEM (red) cells and Ramos (green) cells after 20 min incubation. CEM and Ramos cells formed aggregates. Scale bar: 100 µm. (g) Mixture of Lipo-TD05-TMR-modified CEM (red) cells and Ramos (green) cells from (f) treated with DNase I. Scale bar: 100 µm. (h) 1:5 mixture of lipo-Lib-TMR-modified CEM (red) cells and Ramos (green) cells after 25 min incubation. CEM and Ramos cells remained apart. Scale bar: 100 µm. (i) Mixture of Lipo-Lib-TMR-modified CEM (red) cells and Ramos (green) cells from (h) treated with DNase I. Scale bar: 100 µm.

