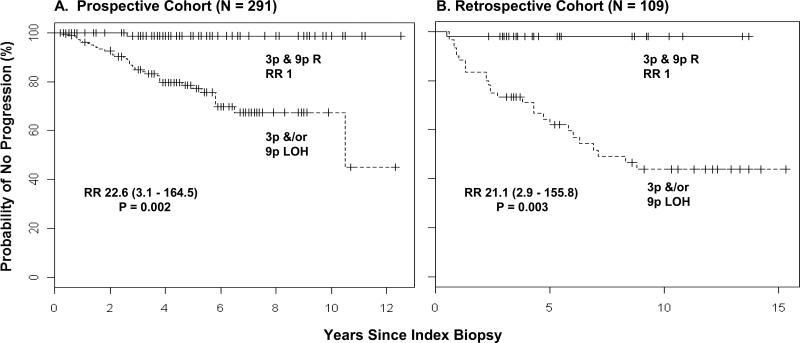
Figure 1. Kaplan-Meier Plot of Time to Progression for the Prospective cohort and the Retrospective Cohort with Risk Stratification by the Previously Reported Model7.
Panel A shows a Kaplan-Meier estimates plot in the prospective cohort using the previous model derived in the retrospective study of 2000, i.e., with a high-risk pattern of 3p &/or 9p LOH and a low-risk pattern of 3p and 9p retention (R): N = 191 for high-risk pattern (of whom 39 progressed); N = 100 for low-risk pattern (of whom 1 progressed). As a comparison, Panel B shows Kaplan-Meier estimates in the earlier retrospective cohort (high-risk pattern, N = 60, of whom 28 progressed; low-risk pattern, N = 49, of whom 1 progressed). For all panels, total numbers are adjusted to reflect informative cases.

