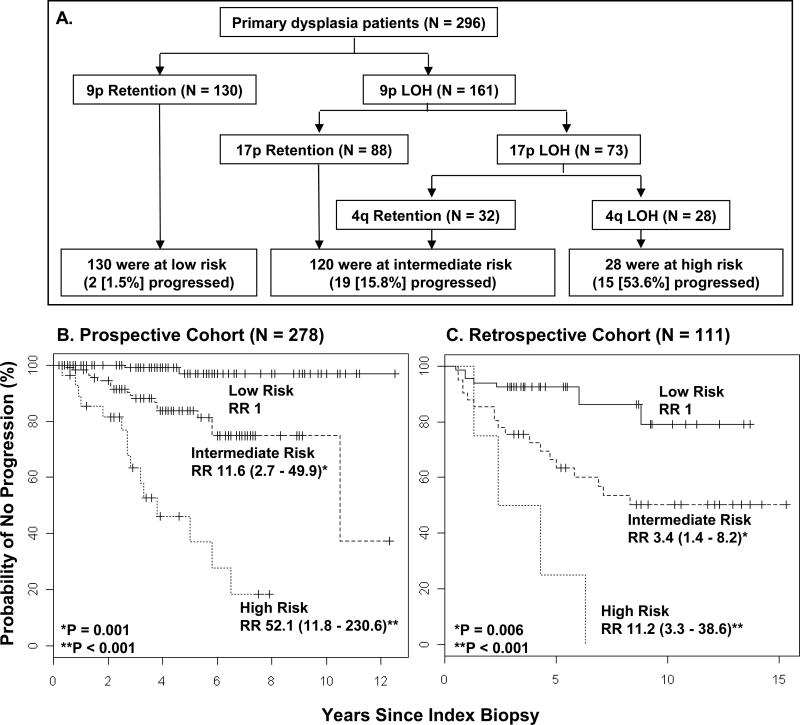
Figure 2. Classification of Study Patients into Risk of Progression Categories and Time to Progression Curves According to Such Categories.
Recursive partitioning analysis was used to identify progressing factors with the most influential predictive significance in a proportional-hazards model for time to progression and to classify patients into categories of low, intermediate, or high risk of progression. Covariates in the analysis were 3p, 4q, 8p, 9p, 11q, 13q and 17p. Panel A shows the resulting classifications. Note that 5 patients were non-informative for 9p and an additional 13 were non-informative for 4q. Panel B and C show data for the Kaplan-Meier plots of time to progression in the classified patients in prospective cohort and retrospective cohort, respectively. For all panels, total numbers are adjusted to reflect informative cases.

