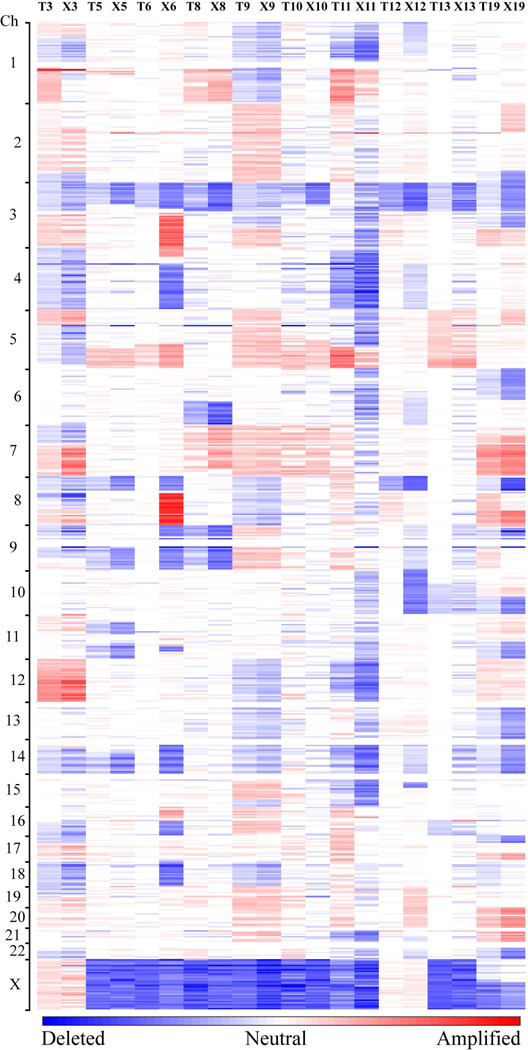
Figure 3. Copy-number profiles of primary RCCs and corresponding xenografts.
Amplifications (red) and deletions (blue), determined by normalized signal intensities from 250K SNP arrays are displayed across the genome (chromosomes are indicated along the y axis) for 10 primary RCC cases (T) and the matched xenografts (X). All cases, with the exception of a papillary RCC case (T11/X11), display low signal intensities at chromosome 3p, reflecting copy loss in that region.

