
Figure 1. Basic properties of ReaChR compared to C-VChR1 (VChR1 with ChIEF N-terminal) and C1V1(E122T).
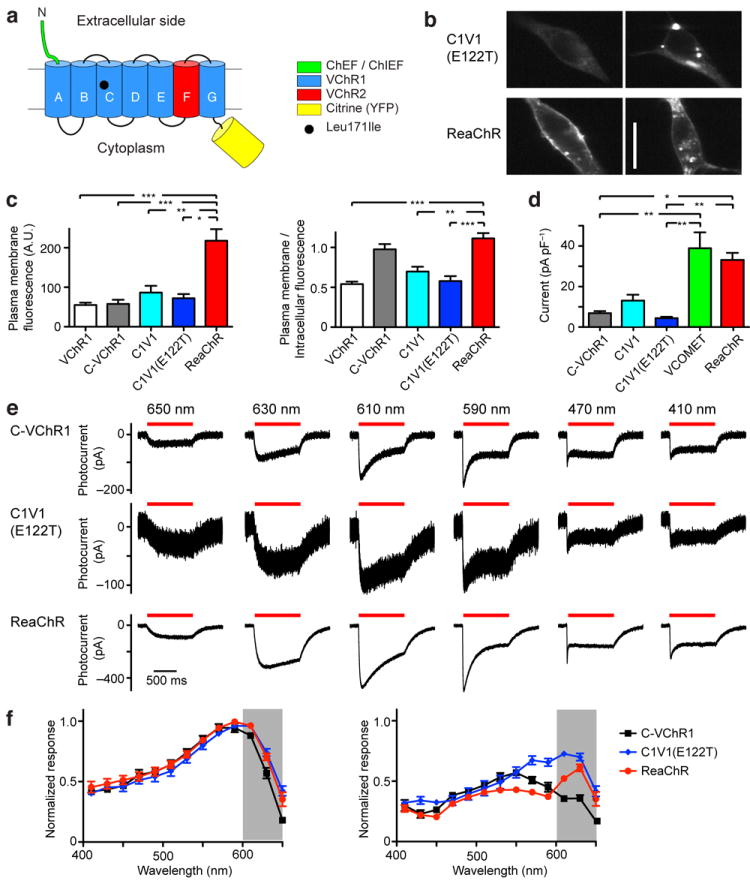
(a) Schematic design of ReaChR. ReaChR consists of the N-terminal of the ChEF/ChIEF variant, transmembrane domain A-E and G of VChR1, transmembrane domain F of VChR2, and a Leu171Ile point mutation. (b) Examples of C1V1(E122T) and ReaChR expression in HEK293 cells as visualized by fluorescence of fused Citrine. Much of ReaChR expression was at the plasma membrane, whereas C1V1(E122T) expression was more intracellular, with strong aggregation. (c) The relative plasma membrane expression level (left) and plasma membrane/intracellular fluorescence ratio (right) of VChR1, C-VChR1, C1V1, C1V1(E122T) and ReaChR as measured with Citrine fluorescence. (d) The mean photocurrent amplitudes of C-VChR1, C1V1, C1V1(E122T), VCOMET and ReaChR recorded from HEK293 cells. The current amplitudes were measured at the wavelengths that evoked the greatest response of each variant and normalized to cell capacitance. (e) The response of C-VChR1 (top row), C1V1(E122T) (middle row), and ReaChR (bottom row) to 650, 630, 610, 590, 470, and 410 nm light of same photon flux (5.1 × 10¹⁶ photon/mm2/s). (f) The spectra of the maximum response (left) and steady-state/plateau response (right) of C-VChR1 (n =7), C1V1(E122T) (n = 8) and ReaChR (n = 7). The responses were normalized to the maximum response of each cell. For statistical comparisons, Kruskal-Wallis tests were used with post-hoc Dunn’s tests on all pairs of variants. H = 31.63, k = 5, P < 0.0001 for the left panel of (c), H = 41.28, k = 5, P < 0.0001 for the right panel of (c), H = 48.02, k = 7, P < 0.0001 for (d). The statistical tests for (d) also include comparison to oChEF and oChIEF. Only significant differences detected with Dunn’s tests with VCOMET or ReaChR are shown on the graphs (*, **, *** indicate significance levels of < 0.05, P < 0.01 and P < 0.001, respectively). Scale bar in (a): 20 μm. The graphs in (c), (d) and (f) are presented as mean ± S.E.M.