
Figure 4. The responses of neurons expressing the different channelrhodopsin variants to 10 Hz pulsed light stimulation train.
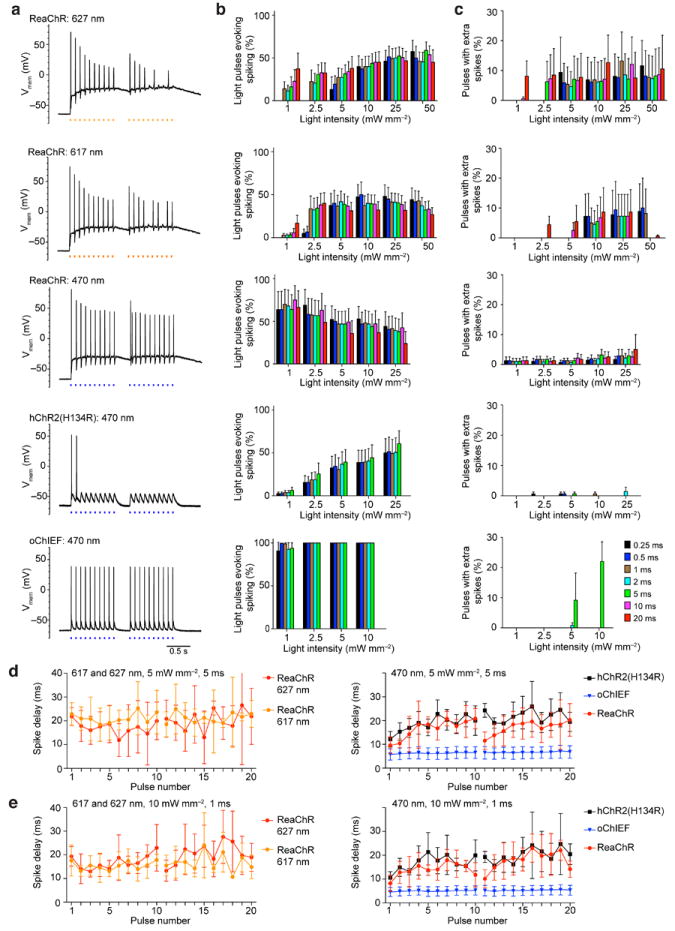
(a) Example recordings of neurons expressing the indicated channelrhodopsin variants to 10 Hz light stimulation at 10 mW/mm2 of 1 ms duration. Two 10 pulses trains 250 ms apart were used to simulate two bursting episodes. Current were injected to sustain the resting membrane potential at -65 mV. (b) The percentage of pulses resulting in action potentials of varying light intensity and pulse duration recorded from neurons expressing the different variants. (c) Percentage of pulses resulting in extra action potentials of varying light intensity and pulse duration of the different variants. 5 - 11 cells were tested in each conditions shown in (b) and (c). (d) and (e) Summaries of the mean latency and the standard deviation of light-triggered action potential of each pulse in ReaChR, hChR2(H134R) and oChIEF-expressing neurons to the indicated wavelength, intensity and duration. Pulses failed to trigger action potential were not included in the analysis, each trace is the average of 5-8 cells and each data points is the average of 2 – 8 values from the cells. (b) and (c) are mean ± S.E.M. (d) and (e) are mean ± S.D.