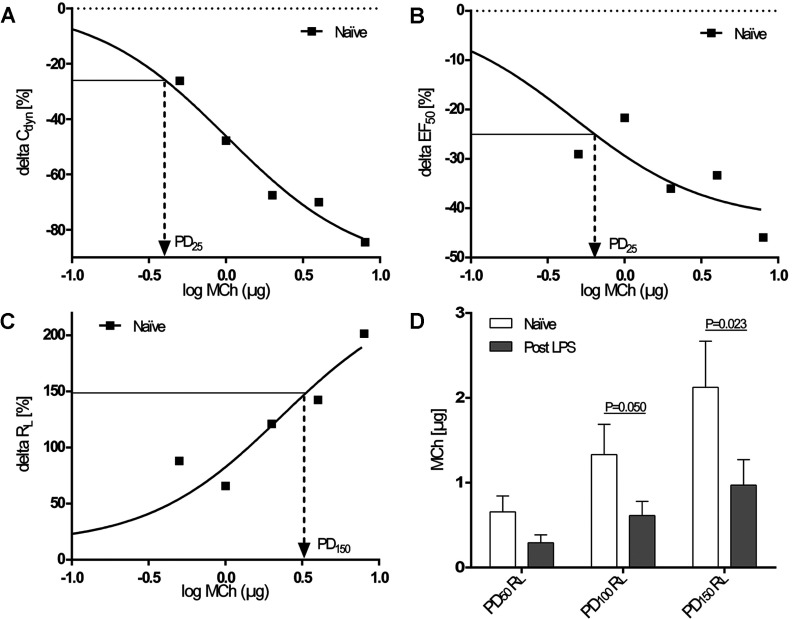
Figure 2. Responsiveness of lung-function parameters to MCh provocation.
(A–C) PDs of MCh were calculated for individual dose–response curves, examples of which are shown for ΔCdyn (A), ΔEF50 (B) and ΔRL (C) in naïve marmosets (R2=0.98, 0.87 and 0.92). Logarithmic MCh values were reversed to obtain PDs. (D) PDs of MCh required to increase RL 50, 100 and 150% above baseline in naïve animals and 18 h after LPS administration. Results are means±S.E.M., n=10 for PD50 and PD100 and n=9 for PD150; paired Student's t test.

