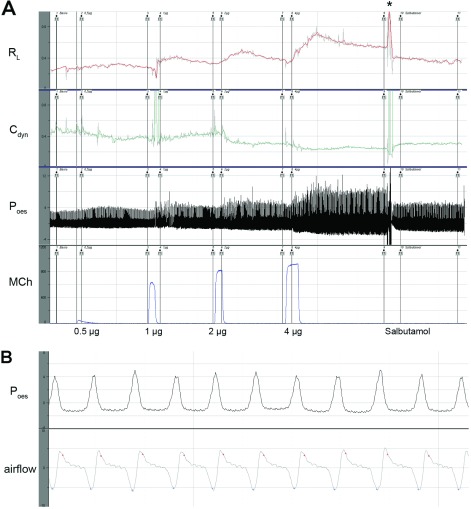
Figure 4. Acquisition of lung-function raw data.
(A) An overview of one complete measurement. From below: photometer signals for applied MCh doses (0.5, 1, 2 and 4 μg). For increasing MCh doses Poes (cmH2O) increased, whereas Cdyn (ml/cmH2O) decreased and RL (cm H2O·s·ml−1) increased simultaneously. At the end of record, a puff of salbutamol caused a decreasing Poes, increasing Cdyn and falling RL. (B) Segment (17 s) of one measurement with individual breaths visible after application of 1 μg of MCh. Poes (cmH2O) on top and airflow (ml/s) below (snapshots from Notocord-hem™ software; *artefact, manipulation of the orotracheally intubated animal for salbutamol administration).

