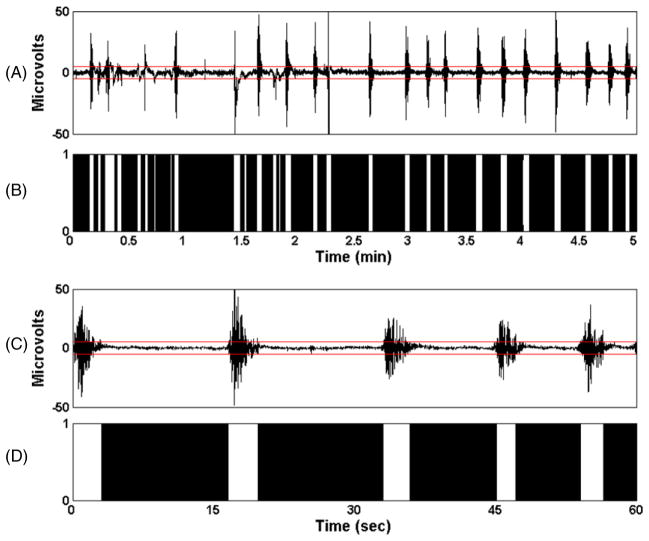
Figure 1.
A. 5-min of burst suppression recorded from a patient following a propofol bolus. The 5-microvolt threshold used for the detection of the binary events is shown in red. B. The corresponding binary time-series where 1 represents a suppression and 0 represents a burst. C. 1-min segment taken from A. D. The binary time-series corresponding to C.

