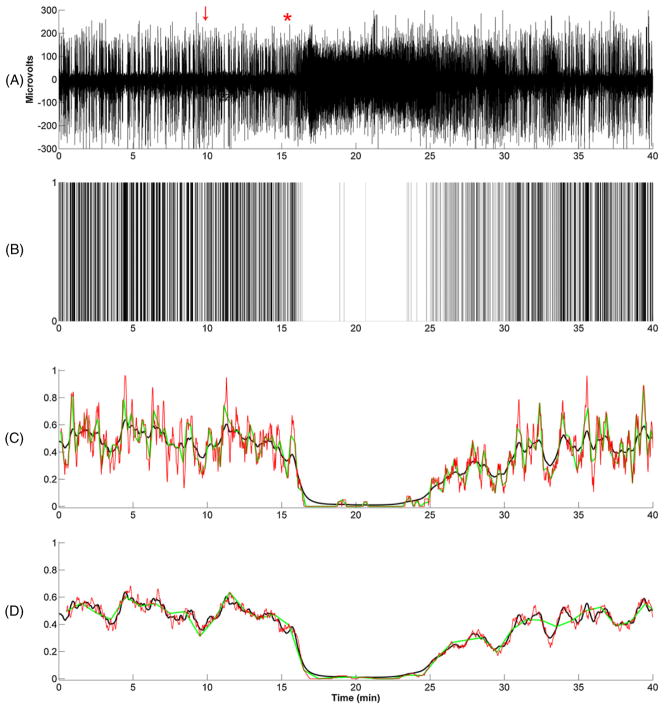
Figure 2.
A. The EEG of an isoflurane anesthetized rat administered physostigmine to assess its arousal effects. At minute 10 (red vertical arrow) normal saline is injected. At approximately minute 16 (red star), physostigmine is injected and the EEG promptly switches from a burst suppression pattern to a dominant delta oscillations. B. The binary time-series associated with A. C. The BSP smoothing algorithm estimate (black curve), the BSR estimate computed using 15-s intervals with no overlap (green curve), and the BSR estimate with 14-s overlap (red curve). D. The BSP smoothing algorithm estimate (black curve), the BSR estimate computed using 60-s intervals with no overlap (green curve), and the BSR estimate with 59-s overlap (red curve).

