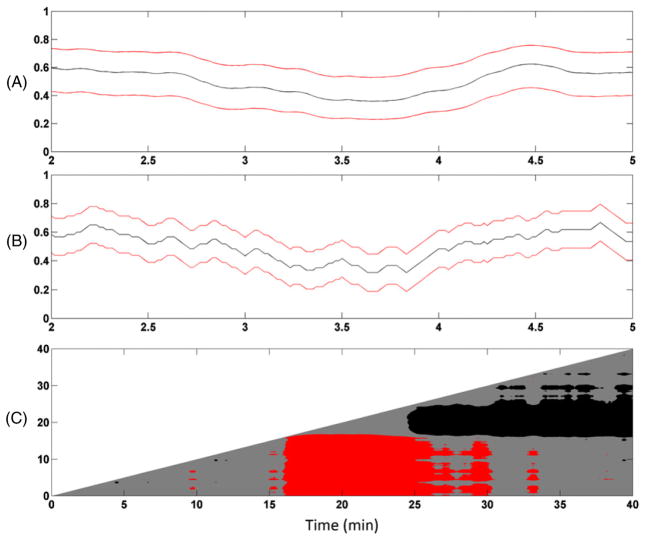
Figure 3.
A. BSP smoothing algorithm estimate (black curve) and its associated 95% confidence (Bayesian credibility) intervals (red curves) for minutes 2–5 in figure 2(C). B. BSR estimate computed with a 60-s interval and 59-s overlap (black curve) and its approximate 95% confidence interval based on the Gaussian approximation to the binomial (red curves) for minutes 2–5 in figure 2(C). C. Point-by-point comparison matrix evaluating the Pr (pj > pi) where pj , the y-axis corresponds to the BSP at time j and pi the x-axis, corresponds to the BSP at time for i, for 1 < j ≤ i. Red (black) means that at the given x, y pair Pr(pj > pi ) > 0.975 (Pr(pj > pi ) < 0.025). Gray means that 0.025 ≤ Pr(pj > pi) ≤ 0.975. The coordinate 20, 15 is red because p15 is substantially greater than p20. The coordinate 25, 20 is black because p25 and p20 are both near 0.

