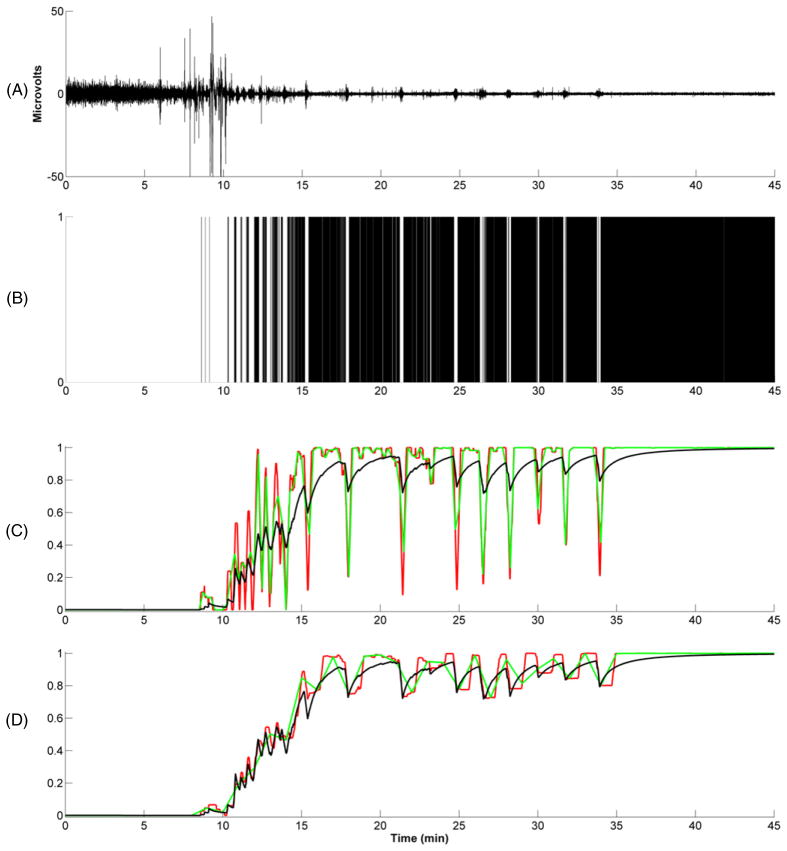
Figure 4.
A. The EEG recorded in a patient undergoing controlled hypothermia. B. The binary time-series associated with A. C. The BSP filter estimate (black curve), the one-sided BSR estimate computed using 15-s intervals with no overlap (green curve), and the one-sided, 15-s BSR estimate with 14-s overlap (red curve). D. The BSP filter estimate (black curve), the one-sided BSR estimate computed using 60-s intervals with no overlap (green curve), and the one-sided, 60-s BSR estimate with 59-s overlap (red curve).

