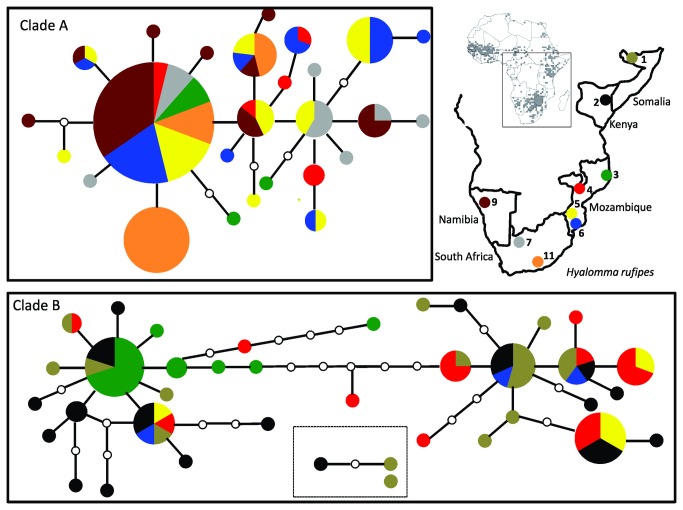
Figure 2. Haplotype network of the 22 mitochondrial COI haplotypes detected from A. hebraeum.
The size of the circles corresponds to the number of individuals characterized by the specific haplotype. Each line separating haplotypes represents one mutational step and missing/intermediate haplotypes are shown by an white circle. Each sampled haplotype is color coded according to the sampling sites indicated on the map inset. Distribution map for A. hebraeum taken from [41,81].

