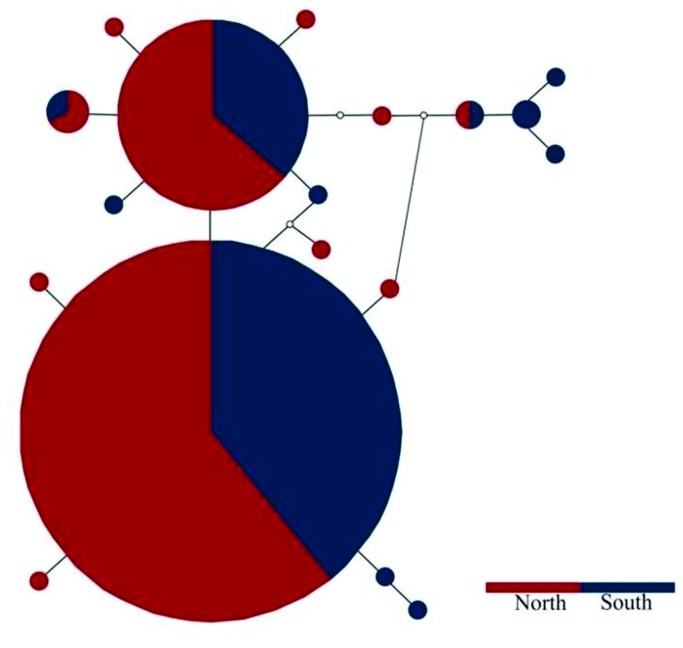
Figure 4. Haplotype network of the 19 ITS-2 haplotypes detected for H. rufipes.
The size of the circles corresponds with the number of individuals represented by the haplotype. Each line separating haplotypes represents one mutational step and missing/intermediate haplotypes are shown by an white circle. For visual comparison between data sets, localities were color coded based on the outcome of the mtDNA analyses (southern clade = red; northern clade = blue) and these are also similarly indicated on the map inset.

