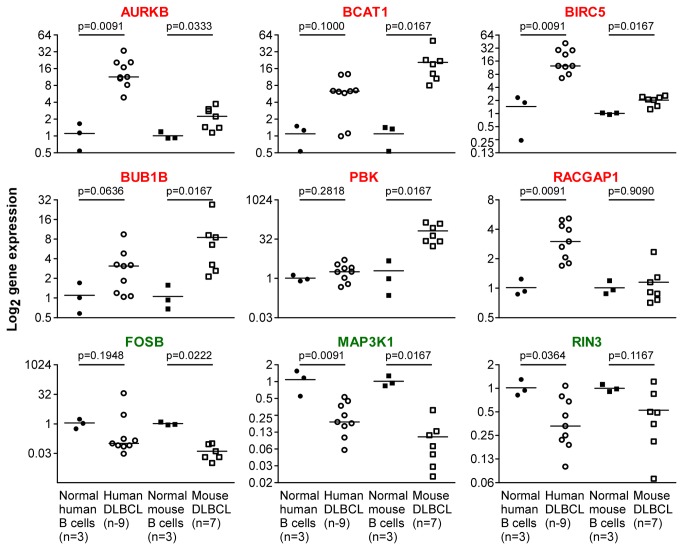
Figure 3. Validation of microarray data using quantitative PCR.
Expression levels of DMB genes found to be up regulated (red; top and center rows) or down regulated (green; bottom row) on microarrays were determined with the assistance of qPCR (ΔΔCT method) in human (circle) and mouse (square) lymphoma (open) counterparts. Normal B cells (closed) were included for comparison. HPRT1 and Hprt were used as internal reference genes for human and mouse samples, respectively. Median gene expression levels are indicated by horizontal lines. Statistical analysis relied on the Mann-Whitney test.

