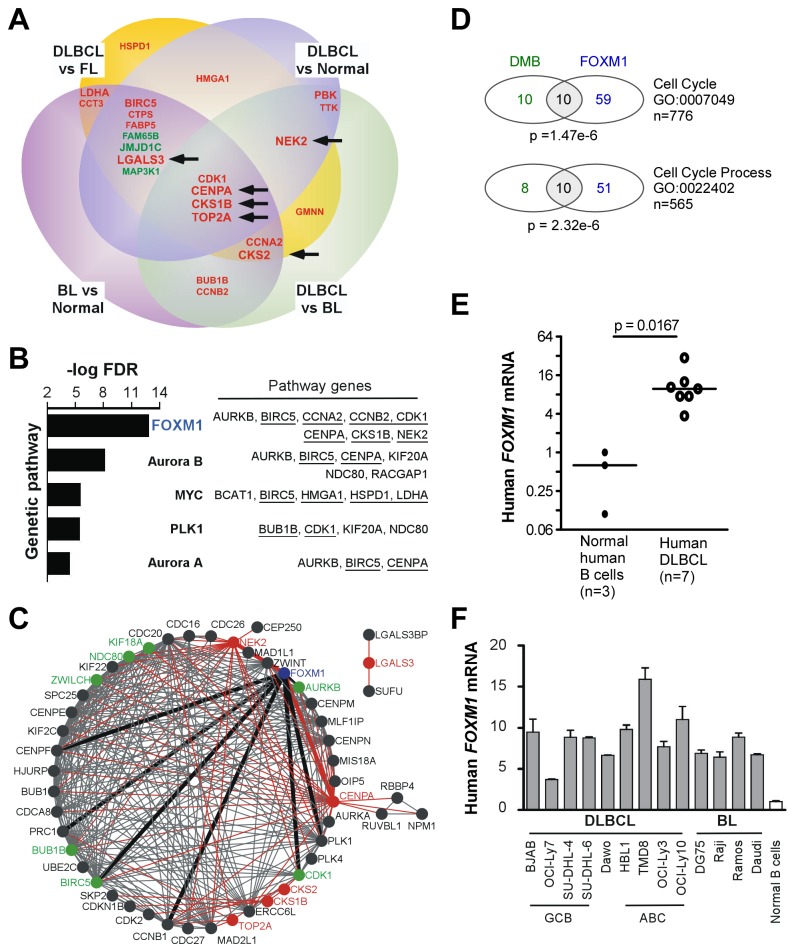
Figure 4. DMB genes are part of the FOXM1 genetic network.
(A) Venn diagram displaying symbols of 23 of 60 DMB genes found to be more than 2-fold up (red) or down (green) regulated (p < 0.01) in at least 2 of 7 independent GEP studies on human lymphoma within the 4 comparison categories listed (see Table S3 for more details). Increasing font size of the gene symbol relates to an increase in the number of independent studies (2, 3, or 4) in which the gene was found to be differentially expressed across all categories. Black arrows denote the 6 genes found in 4 independent studies.(B) Column diagram indicating the result of Pathway Interaction Database (PID) analysis of the 60DMB genes. The 5 most significant pathways are shown. Genes contained in these pathways are shown to the right. Those included in panel A are underlined. (C) Network diagram representing the result of STRING analysis after expansion to a total of 50 nodes, using the 6 top genes from panel A (nodes and connecting edges indicated in red) as the only input genes. Five of 6 genes are part of a major genetic network that includes FOXM1 (node indicated in blue; edges darkened and thickened for emphasis) and 7 additional DMB genes (indicated in green). One of 6 genes, LGALS3, interacts with two other genes outside the FOXM1-associated network. (D) Venn diagrams showing the number of genes (by gene symbol) that overlap between DMB and FOXM1 target genes within the gene ontology (GO) category listed to the right. FOXM1 target genes were taken as defined by Chen et al. [37]. The given p-value indicates that FOXM1 genes are overrepresented in the DMB set and is the result of a Fisher’s Exact test to compare the proportions with a significance level set at p<0.0001. (E) qPCR result unequivocally demonstrating elevated FOXM1 mRNA in DLBCL cells (11.6 ± 3.22; open) relative to normal B cells (0.580 ± 0.258; closed). Median gene expression level is indicated by horizontal lines. Statistical analysis relied on the Mann-Whitney test. (F) Elevation of FOXM1 mRNA in DLBCL and BL cells compared to normal B cells, using qPCR as measurement tool. The classification of DLBCL lines as germinal center B cell (GCB) or activated B cell (ABC) type is indicated at the bottom. The assignment of Dawo to either of these categories is unclear.

