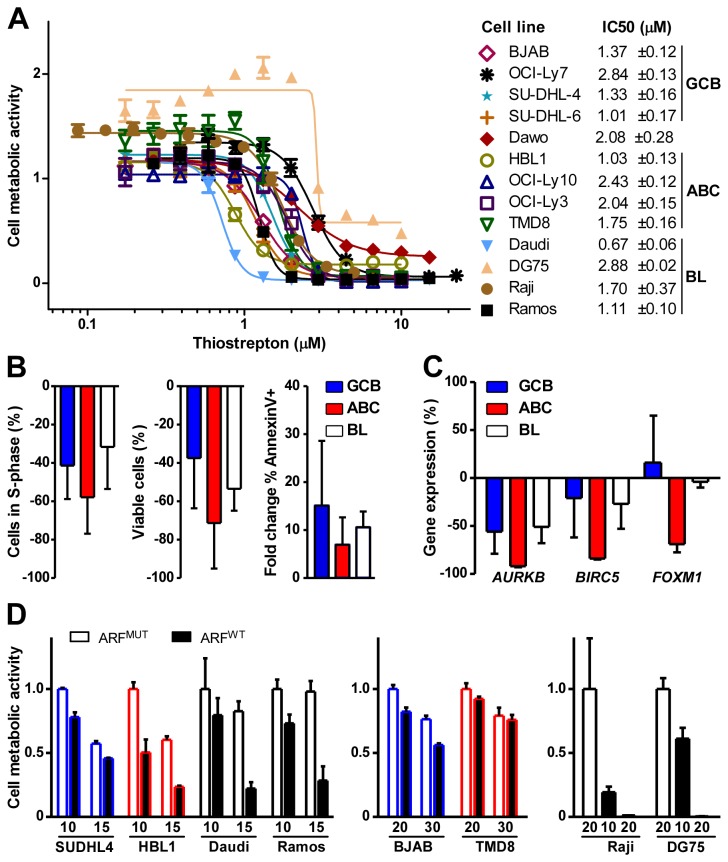
Figure 5. FOXM1 inhibitors impair growth and survival of DLBCL and BL cells in vitro.
(A) Determination of the mean inhibitory concentration (IC50) of thiostrepton in 13 cell lines. Nine DLBCL and 4 BL cell lines were treated for 24 hrs with increasing concentrations of drug. Dose response curves are representative of at least three independent experiments. Cell metabolic activity was measured using the MTS assay. IC50 values and standard deviations are shown to the right. (B) Thiostrepton-dependent inhibition of cell proliferation and increased cell death. Tumor cell lines were exposed for 24 hrs to DMSO (vehicle control) or thiostrepton at IC50 levels shown in panel A, followed by flow cytometric determination of cells in S phase (DNA content analysis, left panel), number of viable cells (Guava ViaCount® analysis, middle panel), and apoptotic cells (annexin V immunoreactivity, right panel). Results are grouped by molecular subtype and shown as the average percent difference of the mean ± SD of thiostrepton- versus DMSO-treated cells. (C) Thiostrepton-dependent loss of gene expression. Cells were treated as described in panel B. RNA was isolated and gene transcript levels were measured using qPCR. Data are presented as described in panel B. (D) ARF peptide-dependent loss of cell metabolic activity. Four DLBCL and 2 BL cell lines were treated for 24 hrs with the indicated concentration (µM) of wild-type (WT) ARF peptide (black bars) or mutant (MUT) peptide (white bars) used as control. Cell metabolic activity was measured using the MTS (SUDHL4, BJAB, HBL1, TMD8) or CellTiter-Glo® (Daudi, Ramos, Raji, DG75) assays and is normalized to the mean of the lowest concentration of MUT peptide treatment per cell type. Blue, red and black outline colors indicate GCB, ABC, and BL cell lines, respectively. Data are representative of at least two independent experiments.

