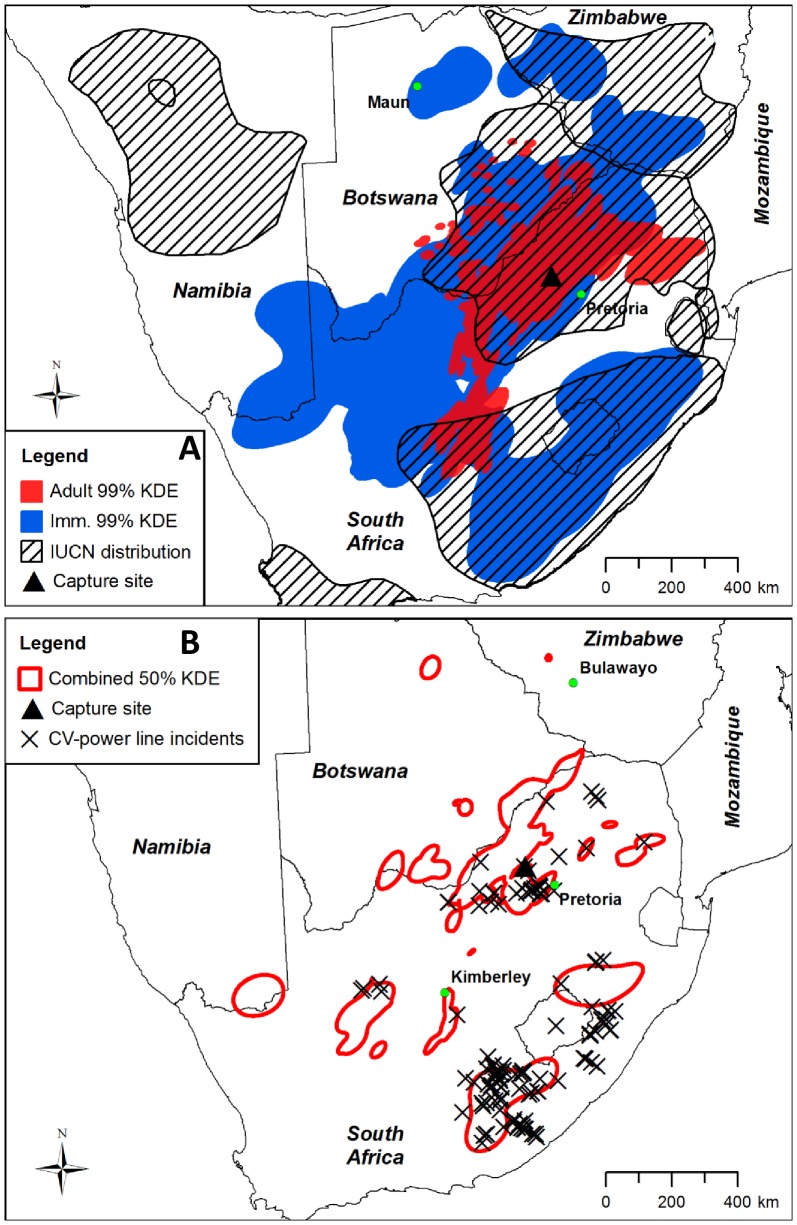
Figure 1. Home ranges of nine Cape vultures with species distribution map and Cape vulture-power line incidents.
(A) Shaded red and dark blue polygons represent the combined 99% kernel density estimated (KDE) contours of all adult and immature vultures, respectively. The diagonal line shaded polygons represent the extent of the Cape vulture species distribution according to BirdLife International [37]. The capture site is indicated by a black triangle. (B) The hollow red polygons represent the combined 50% KDE contours of all nine vultures. Black crosses show locations of Cape vulture-power line incidents recorded in the Central Incident Register of the EWT-Eskom strategic partnership [39].

