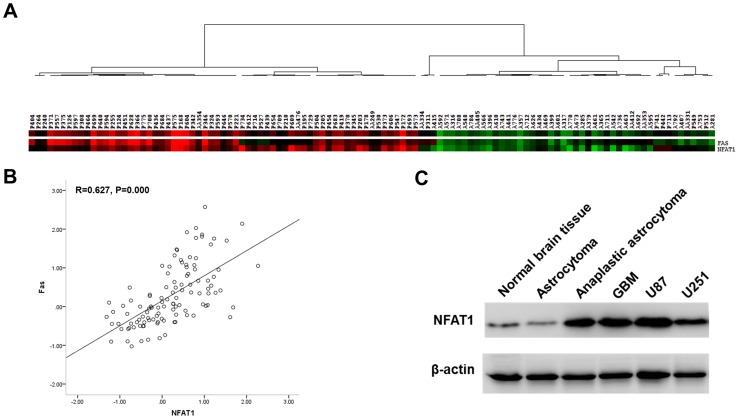
Figure 4. The mRNA expression of NFAT1 and Fas obtained from microarray analysis in 111 clinical samples was analyzed by cluster analysis and Pearson correlation analysis.
(A) NFAT1 was overexpressed in high-grade gliomas. (A, B) The expression of NFAT1 significantly correlated with the expression of Fas in gliomas. (C) Western bot showed that NFAT1 was highly expressed in GBM clinical samples as well as in U87 and U251 cells, compared with low-grade glioma and normal brain tissue samples. The graph is a representative of three independent experiments.

