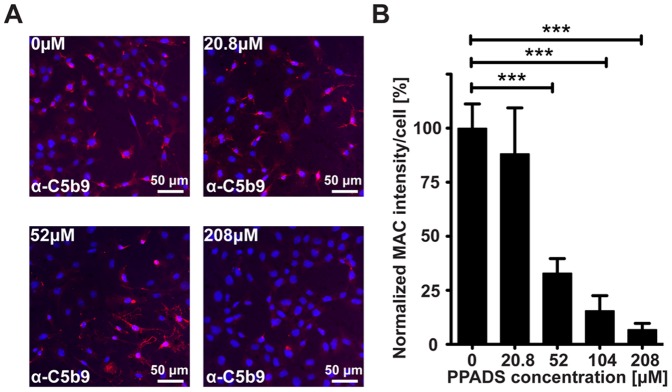
Figure 3. PPADS Inhibits Formation of MAC in vitro.

A) Representative images of C5b9 labeling (red) of cells incubated with increasing concentrations of PPADS. Nuclei are counterstained with DAPI (blue). B) Mean values ± SEM of C5b9 staining intensity per cell at various concentrations of PPADS. Values represent cumulative data from 4 independent studies. Significant differences are indicated as capped lines between vehicle control (0.9% NaCl, 0 µM PPADS) and the various concentrations of PPADS (*** p<0.0005, ** p<0.005, * p<0.05).
