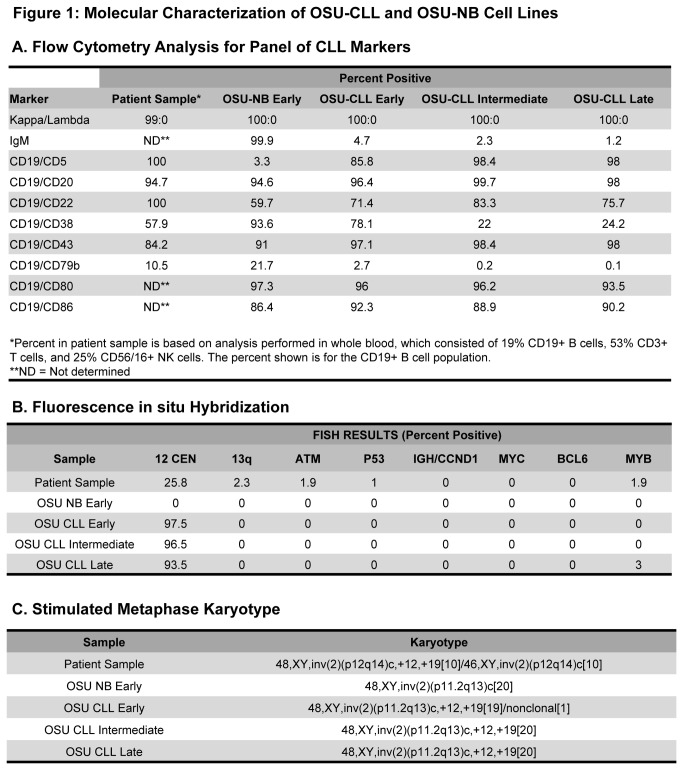
Figure 1. Molecular characterization of OSU-CLL and OSU-NB cell lines.
Analysis is performed in patient sample from which the cell lines were derived as well as cultured cells from both lines (approximate timing: early = 3 months, intermediate = 6 months, late = 9 months). A. Flow cytometric analysis for CLL related surface molecules. Flow cytometric analysis for selected B-cell markers, shown as the percent of cells positive. B. Fluorescence in situ hybridization. Interphase FISH analysis for a panel of cytogenetic abnormalities associated with CLL: trisomy 12 (centromere), del(13q14) (D13S319), del(11q22.3) (ATM), del(17p13.1) (TP53), t(11;14) (CCND1-IGH fusion), +8 (MYC), +3 (BCL6), and del(6q22.3) (c-MYB). C. Karyotype analysis. Metaphase karyotype analysis to determine any additional chromosomal abnormalities not identified by FISH analysis.

