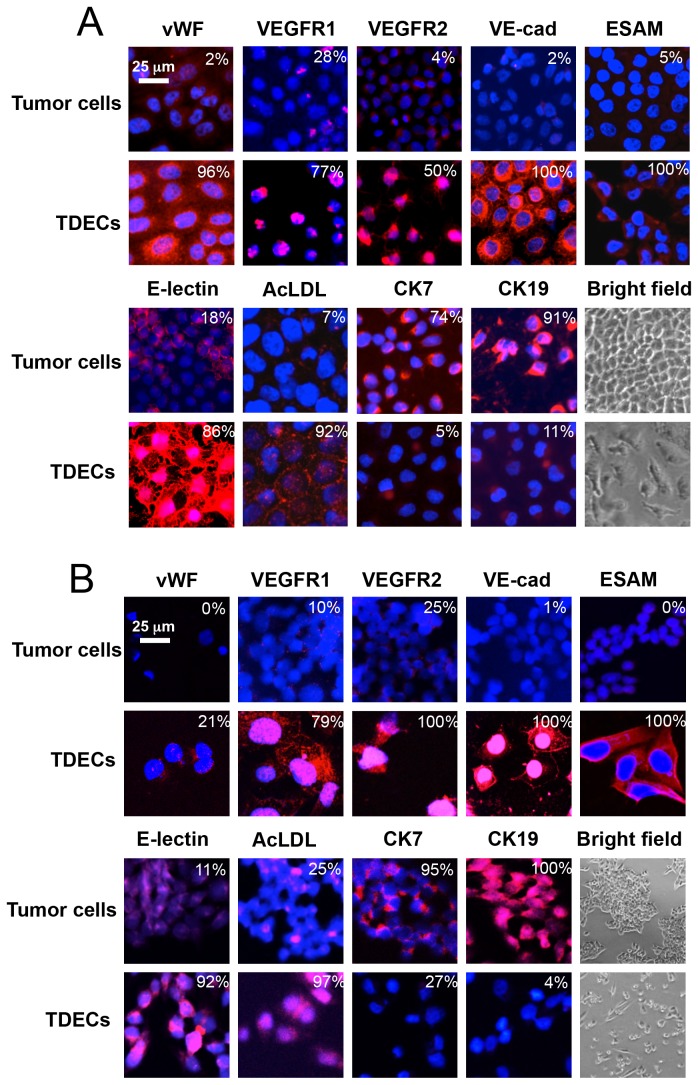
Figure 1. Immunofluorescent staining of tumor cells grown under standard conditions and under optimal conditions to induce TDECs.
(A) H460 cells were grown for 5 d under condition 3. (B) OVCAR3 cells were grown for 5 d under condition 4. Antibody staining for the EC-specific markers vWF, VEGFR1, VEGFR2, VE-cadhherin, ESAM, binding of E-lectin and uptake of acetylated AcLDL were performed on both sets of cells as previously described [24,25]. Epithelial marker staining was performed for CK7 and CK19. Counterstaining with DAPI was performed to visualize nuclei. Bright field images of tumor cells and TDECs are also included. Images were obtained at either 40-60X magnification (confocal) or 10X magnification (bright field). Numbers in the upper right hand corner of each panel indicate the percentage of each population that demonstrated any evidence of staining, irrespective of its intensity. Similar results were obtained in at least three independent experiments. Scale bar = 25 um.

