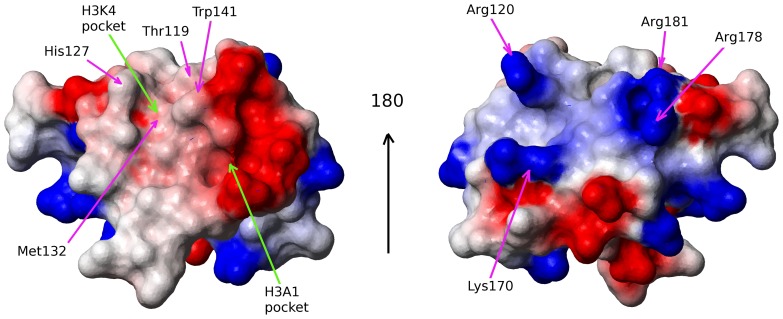
Figure 3. Molecular surface representation of the PHD domain shown from two points of view.
The surface is colored according to electrostatic potential (red for negative charges and blue for positive charges). The orientation of the domain is as in Figure 1. MOLMOL [28] was used to create this figure.

