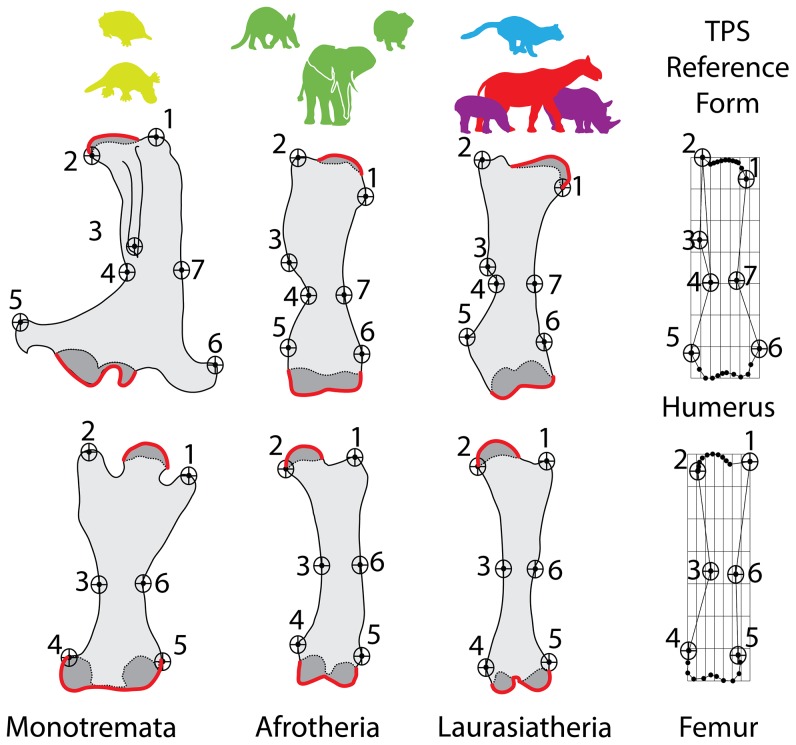
Figure 1. Landmarks digitized for 2-D thin-plate splines (TPS) geometric morphometrics (GM) analyses – Mammals.
All drawings are not to scale and were enlarged or reduced to facilitate comparisons. For the humerus, landmarks 1 and 2 encompass the region between the greater tubercle and the medial extent of the humeral head. Landmarks 2, 3, and 4 encompass the extent of the deltopectoral crest. Landmarks 4 and 7 encompass the narrowest point of the midshaft. Landmarks 5 and 6 denote the lateral and medial epicondyles, respectively. For the femur, landmarks 1 and 2 encompass the region between the greater trochanter and the medial extent of the proximal end of the femur. Landmarks 3 and 6 encompass the narrowest point of the midshaft. Landmarks 4 and 5 denote the the lateral and medial epicondyles. Regions of sub-articular bone are indicated in dark gray and the digitized outlines that were subsequently converted into chains of 10 evenly-spaced semi-landmarks are colored red. The exemplar taxa represented as bones, left to right, are: Ornithorhynchus, Mammut, and Paraceratherium. The TPS reference forms which describe the shape of the bones mathematically is shown at right.

