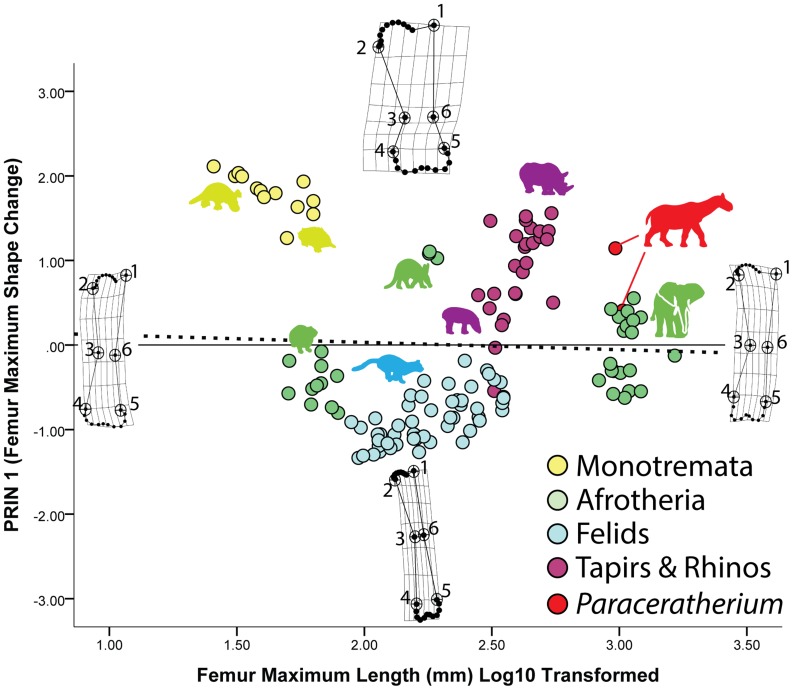
Figure 4. Changes in femur shape in mammals.
Maximum femur shape change in the sample is shown on the Y-axis (PRIN 1), whereas femur shape changes associated with size are shown on the X-axis. As with the humerus, monotreme specimens plot among the most robust femora on the PRIN 1 axis, but aardvarks, rhinos, and one Paraceratherium specimen also plot in robust morphospace. Once again, the sub-articular bone region narrows significantly with increasing size and that the shapes of these regions become more defined, convex, and/or distinct. Notice also that the femoral head becomes more distinct and medially-oriented with increasing size.

