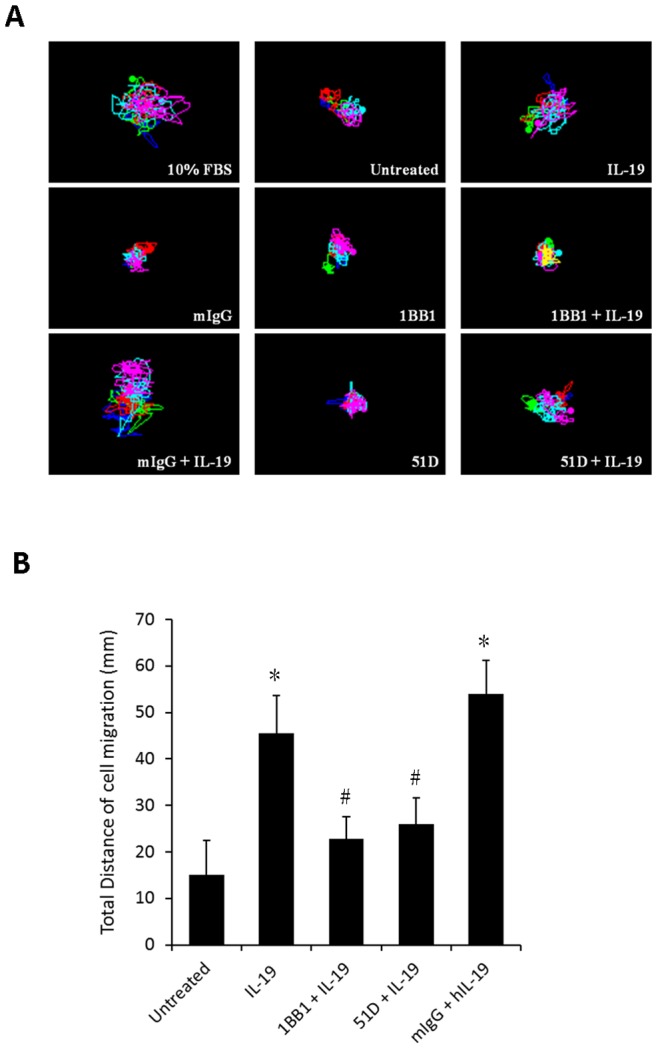
Figure 4. IL-19 induced migration in CE81T cells.

Real-time migration for CE81T cells was monitored using a JuLI smart fluorescent cell analyzer. (A) Motion graph of CE81T cells (count = 5 cells). (B) Quantization of the motion distance (in µm) of CE81T cells (count = 5 cells) (10% FBS was the positive control; IgG, the negative control of anti-IL-19 monoclonal antibody (1BB1) and anti-IL-20R1 monoclonal antibody (51D). All groups: n = 3. *P<0.05 compared with untreated group, #P<0.05 compared with IL-19 group.
