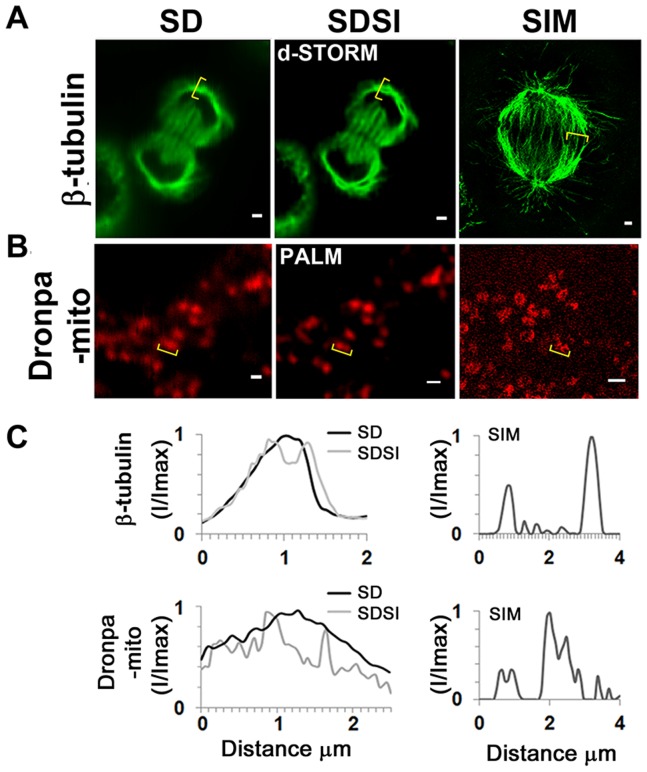
Figure 4. Comparison between single channel SDSI super-resolution imaging and SIM imaging in a medial plane of HeLa cells.
(A) Comparison of SD, SDSI-dSTORM and SIM images of the mitotic spindle, the spindle was visualised using β-tubulin antibodies. Secondary Fab fragment antibodies conjugated to AlexaFluor647 were used for dSTORM imaging. SR data was generated using 3rd order SOFI, bar = 1 µm. (B) Comparison of SD, SDSI-dSTORM and SIM images of the mitochondria, the mitochondria were visualised by transfecting cells using the Dronpa-Mito construct for PALM imaging, SR data was generated using 3rd order SOFI, bar = 1 µm. (C) Line-scans (indicated in yellow parenthesis) through the mitotic spindle and mitochondria comparing SD resolution with SDSI and SIM.

