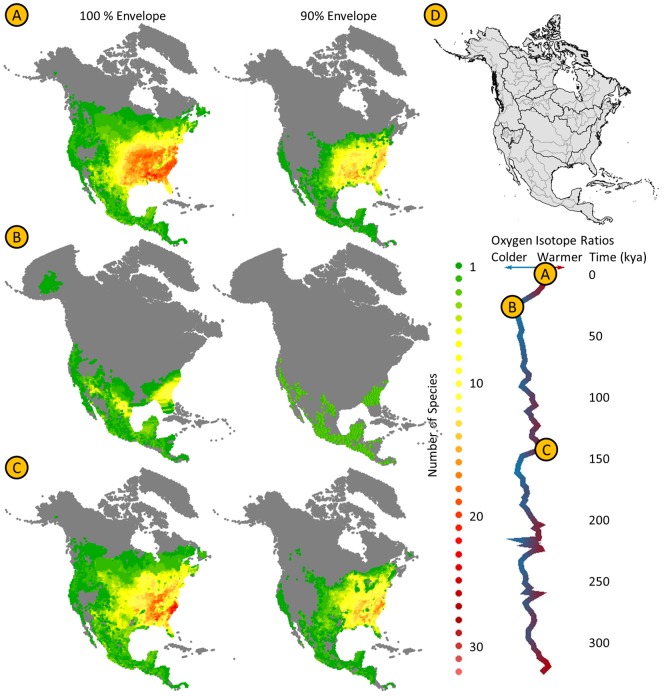
Figure 2. Predicted current species richness according to 100% and 90% environmental envelopes (A) as well as historic fluctuations as projected for the last glacial maximum 21 ky BP (B) and the last interglacial (C) according to palaeophylogeographic models of 59 Nearctic chelonians.
Dispersal capacities per species were restricted to the corresponding watersheds (D). For full videos see Appendix S4 in Material S1.

