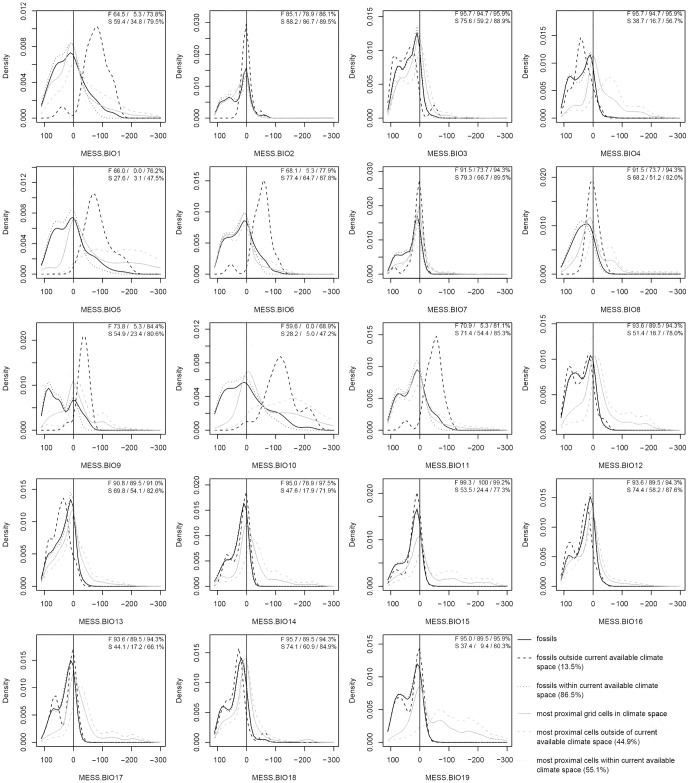
Figure 4. Historic niche dynamics in Nearctic chelonians based on 141 fossils and the five most proximal (SIM5) 50 km2 points in climate space in those cases where species find no analogous climates to their past potential niche.
Positive MESS scores indicate conditions within the species' modern potential niche and negative MESS scores indicate bioclimatic conditions outside of the modern potential niche. Solid lines refer to the complete set of fossils (black) and SIM5 points (gray), wherein dotted lines refer to subsets nested across all variables within the species' potential niche. Percentages provided in each subplot refer to the proportion of records within the species' current realizable niche and the respective subsets (total/within potential niche/outside of potential niche) for fossils (F) and SIM5 (S). Dashed lines refer to subsets of exeeding those conditions currently available to the species in at least one predictor. Abbreviations are: BIO1 = annual mean temperature; BIO2 = mean diurnal range; BIO3 = isothermality; BIO4 = temperature seasonality; BIO5 = max temperature of warmest month; BIO6 = min temperature of coldest month; BIO7 = temperature annual range; BIO8 = mean temperature of wettest quarter; BIO9 = mean temperature of driest quarter; BIO10 = mean temperature of warmest quarter; BIO11 = mean temperature of coldest quarter; BIO12 = annual precipitation; BIO13 = precipitation of wettest month; BIO14 = precipitation of driest month; BIO15 = precipitation seasonality; BIO16 = precipitation of wettest quarter; BIO17 = precipitation of driest quarter; BIO18 = precipitation of warmest quarter; BIO19 = precipitation of coldest quarter; MESS: Multivariate Environmental Similarity Score.

